Investigating the Relationship Between Weight and Height among Providence Island's Residents

- Problem Description:
- Variables:
- Data:
- Results:
- Summary and Discussion:
- RStudio script:
This Data Analysis assignment presents a comprehensive study in which we delve into the intriguing relationship between weight and height among the diverse residents of Providence Island. Understanding this connection is vital, as it provides valuable insights into the health and body composition of individuals. Our research aims to contribute to the existing knowledge in this domain, offering potential benefits for healthcare professionals and policymakers. With meticulous data collection, analysis, and visualization, we unveil a compelling positive correlation between weight and height, shedding light on how these two variables intersect in the context of health and well-being. Explore the results and draw your conclusions from this fascinating exploration.
Problem Description:
The primary focus of this study is to comprehend the correlation between an individual's weight and height, particularly among the population of Providence Island. This is a crucial aspect as it provides essential insights into the overall health and body composition of individuals. Furthermore, this information can be highly beneficial for various applications, such as evaluating nutritional status, devising effective weight management strategies, and recognizing potential health risks linked to weight and height variations. Through this comprehensive investigation, we aim to expand the existing knowledge in this domain and, in turn, provide valuable insights for health practitioners and policy makers.
Variables:
Response Variable: Weight(continuous)
Explanatory Variable: Height(continuous)
Methods:
- Sampling Strategy:A straightforward random sampling approach was utilized to gather a sample of residents from Providence Island. This method ensured that each resident had an equal opportunity to be included in the study. Employing a random number generator, each resident received a unique identifier, and subsequently, a sample of 36 individuals was randomly chosen to form the study sample.
- Population of Interest: The scope of this study extends to encompass all residents of Providence Island. The collected sample aims to be representative of the broader population residing on the island.
- Data Collection: Data collection was carried out across different towns on Providence Island, specifically in Nelson, Takazaki, Hayarano, and Shinobi. The data collection procedure involved visiting these areas and approaching households to request their voluntary participation in the study. Informed consent was obtained from the participants, or from their parents/guardians in cases involving minors. The information recorded for each participant included the town name, individual's name, age group, weight (in kilograms), and height (in centimeters).
- Study Type:The study employed an observational approach, meaning that data concerning weight and height was collected without any form of intervention or manipulation. The primary objective was to delve into the relationship between weight and height among the inhabitants of Providence Island.
Data:
Table 1: Data of Weight and Height among Inhabitants of Providence Island
| S/No | Town | Names | Age group | Weight (Kg) | Height (cm) |
|---|---|---|---|---|---|
| 1 | Nelson | Jamie Wilson | 18 | 71.4 | 173.4 |
| 2 | Nelson | Dianne Morrison | 27 | 43.7 | 152.8 |
| 3 | Nelson | Nicolas Gagnon | 26 | 79.7 | 187.3 |
| 4 | Nelson | Ruby Collins | 15 | 63.7 | 166.6 |
| 5 | Nelson | Zachary Price | 1 | 9.4 | 81.5 |
| 6 | Nelson | Aahna Kaur | 22 | 75.7 | 170 |
| 7 | Nelson | Lila Collins | 14 | 39.3 | 151.6 |
| 8 | Nelson | Hayley Johnstone | 16 | 55.3 | 168.6 |
| 9 | Nelson | Yuka Wilson | 17 | 76.8 | 169.3 |
| 10 | Takazaki | Nico Sorensen | 14 | 53.6 | 161.2 |
| 11 | Takazaki | Robin Morris | 15 | 63.8 | 170.2 |
| 12 | Takazaki | Julian Eklund | 19 | 82.9 | 175.6 |
| 13 | Takazaki | Percy Lemaitre | 14 | 60.7 | 171 |
| 14 | Takazaki | Madison Collins | 10 | 39.9 | 141.8 |
| 15 | Takazaki | Noah Connolly | 19 | 63.3 | 172 |
| 16 | Takazaki | Elise Erickson | 22 | 50.9 | 163.4 |
| 17 | Takazaki | Felix Pallesen | 15 | 82.6 | 175.4 |
| 18 | Takazaki | Matthew Connolly | 15 | 59.4 | 173.4 |
| 19 | Hayarano | Klya Mccarthy | 9 | 37.8 | 145.9 |
| 20 | Hayarano | Hanne Sorensen | 15 | 48.6 | 166.3 |
| 21 | Hayarano | Vladimir Riedel | 8 | 32.2 | 133.9 |
| 22 | Hayarano | Elsa Sorensen | 12 | 50.8 | 155.3 |
| 23 | Hayarano | Souta Connolly | 17 | 81.1 | 175.7 |
| 24 | Hayarano | Nathan Connolly | 5 | 19.6 | 118 |
| 25 | Hayarano | Chota Yamada | 18 | 72.8 | 176.4 |
| 26 | Hayarano | Chloe Regan | 18 | 62.8 | 170.2 |
| 27 | Hayarano | Garthy Ganier | 8 | 30.9 | 127.5 |
| 28 | Shinobi | Lucinda Carlsen | 8 | 25.4 | 128.4 |
| 29 | Shinobi | Raum Lund | 14 | 52.6 | 173 |
| 30 | Shinobi | Brenda Blomgren | 11 | 44.9 | 148.9 |
| 31 | Shinobi | Lars Solberg | 10 | 50.8 | 148 |
| 32 | Shinobi | Alicia Abbasi | 8 | 30.1 | 128 |
| 33 | Shinobi | Olson Lund | 17 | 56.7 | 173.3 |
| 34 | Shinobi | Satoru Watabe | 5 | 21 | 109.8 |
| 35 | Shinobi | Sebastian Scholz | 18 | 67.2 | 169.6 |
| 36 | Shinobi | Beau Morris | 12 | 44.5 | 160.6 |
Results:
Table 2:Sample Statistics of Weight and Height among Inhabitants of Providence Island
| Statistics | Weight (Kg) | Height (cm) |
|---|---|---|
| Minimum | 9.4000 | 81.5000 |
| Q1 | 39.7500 | 147.5000 |
| Median | 53.1000 | 166.4500 |
| Mean | 52.8306 | 156.4972 |
| SD | 19.2239 | 22.7250 |
| Q3 | 64.6500 | 172.2000 |
| Maximum | 82.9000 | 187.3000 |
Figure 1:Scatterplot of Weight and Height among Inhabitants of Providence Island
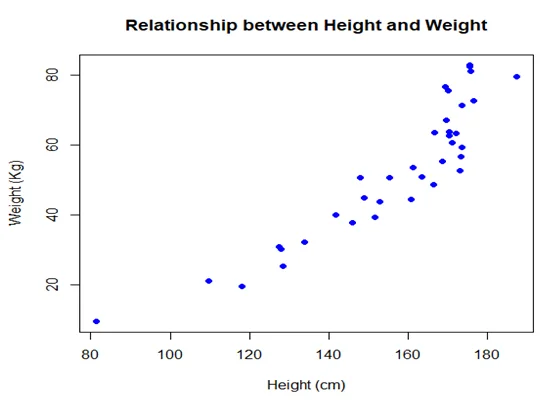
The scatterplot vividly illustrates a robust positive linear relationship between weight and height among the inhabitants of Providence Island. While individual data points show some variability, the overall trend is clearly upwards, signifying that as weight increases, height also tends to increase. The scatterplot strongly confirms the positive association between weight and height within the dataset.
Summary and Discussion:
The sample statistics and the scatterplot contribute critical insights into the intricate relationship between weight and height among Providence Island's residents. The mean weight of the sample hovers around 52.83 kg, with a standard deviation of 19.22 kg. In parallel, the mean height is approximately 156.5 cm, with a standard deviation of 22.73 cm. This evident correlation between weight and height implies that individuals with higher weights also tend to be taller. However, it's imperative to acknowledge the potential influence of age as a confounding variable. Age can significantly affect both weight and height, especially in the context of growth and development. Younger individuals may exhibit lower weights and heights in comparison to their older counterparts. Therefore, to account for this potential confounder, it is essential to incorporate age as a variable and analyze its influence on the weight-height relationship.
RStudio script:
Data <- read.csv("Height.csv") summary(Data$Weight) sd(Data$Weight) summary(Data$Height) sd(Data$Height) plot( Data$Weight ~ Data$Height, main = "Relationship between Height and Weight", xlab = "Height (cm)", ylab = "Weight (Kg", col = "blue", pch = 16, cex = 2, lwd = 1.5, bg = "lightblue" )Related Samples
Explore an array of exemplary statistical assignments showcasing diverse topics and methodologies. Our sample section offers a glimpse into the depth and breadth of our expertise, providing valuable insights for students and professionals alike. Delve into various statistical concepts, methodologies, and applications through our curated collection of samples. Each example illustrates the quality and proficiency we bring to every statistical assignment.
R Programming
R Programming
R Programming
R Programming
R Programming
R Programming
R Programming
R Programming
R Programming
R Programming
R Programming
R Programming
R Programming
R Programming
R Programming
SAS
R Programming
R Programming
R Programming