Unwinding Trends in Firearms Data and Serum Creatinine Levels
- Problem Description:
Delve into a detailed examination of two distinct datasets, unravelling intriguing patterns in firearms data and serum creatinine levels within the context of a data analysis assignment. The first section dissects the relative risk (RR) for men, spotlighting a pivotal shift around 1997. Factors such as evolving firearm policies, public awareness initiatives, enhanced mental health interventions, and socioeconomic dynamics are scrutinized to unravel the underlying causes behind the observed patterns. The second part meticulously analyzes serum creatinine data, emphasizing years with notably lower mean levels and revealing the nuanced trajectory of creatinine levels across the study period. This exploration not only unravels statistical intricacies but also offers valuable insights into the multifaceted nature of societal and health-related phenomena.
| Tablesyear__1 | Tablesrasemale__2 | Tablesci_lov..__3 | Tables cs_upp-__4 | Tablesrev_mala__5 | Tablesci_lov..__6 | Tablesei_upp..__7 |
|---|---|---|---|---|---|---|
| 1978 | -094086 | .0665315 | -1330525 | -722408 | -6383163 | -817578 |
| 1979 | -1114058 | -0809916 | -1532414 | .8110368 | -7194936 | -9142272 |
| 1980 | -1174603 | -083553 | -1651278 | .8067227 | -7153239 | -9097998 |
| 1981 | -1377049 | .0997362 | -1901281 | -6801196 | -6037562 | 7661414 |
| 1982 | -0985916 | .0696678 | -1395234 | -7662141 | -682591 | -8600818 |
| 1983 | -1047904 | .0739757 | -148441 | -7260479 | .6459319 | -8161008 |
| 1984 | -1554054 | -1139099 | -212017 | -6770538 | .6028446 | .7603981 |
| 1985 | -152027 | -1111028 | -2080255 | -6550388 | -5856456 | -7326544 |
| 1986 | -1195335 | -0864633 | -1652525 | -5872833 | -5263423 | .6552801 |
| 1987 | -1038251 | -0743406 | -1450037 | .5032988 | -4535904 | -5584546 |
| 1988 | -0848806 | -0591667 | -1217698 | -4715526 | -4234836 | -5250778 |
| 1989 | 0911854 | .0627458 | -1325153 | .4017175 | -3587615 | -4498169 |
| 1990 | .0963855 | 0670582 | -1385389 | -4153005 | -372342 | -4632154 |
| 1991 | -0579345 | -038052 | .0882058 | -4165954 | .3748066 | -4630435 |
| 1992 | .0695187 | -0467154 | -1034532 | -3982833 | .3576561 | -4435254 |
| 1993 | .0534591 | -032819 | .08708 | .3881151 | .3466645 | -4345221 |
| 1994 | .058651 | -0373625 | -0920694 | -3378378 | .3016352 | -3783856 |
| 1995 | _0586735 | .0385317 | -089344 | -2854914 | -2541837 | -3206552 |
| 1996 | -0379747 | -0226765 | .0635933 | -272929 | .2432517 | 3062269 |
| 1997 | -0446809 | -028858 | -0691793 | -1968153 | -1742147 | -2223478 |
| 1998 | -0384615 | -0236943 | .0624323 | .1266705 | -1100228 | -1458373 |
| 1999 | 0323383 | .0186142 | -0561809 | -1673177 | -146614 | -190945 |
| 2000 | -0232019 | 0123948 | -0434316 | -1466942 | -1270452 | -1693822 |
| 2001 | -0452489 | -0289076 | -0708278 | -1659808 | -1448685 | -1901699 |
| 2002 | -0257611 | -0141589 | -0468706 | -1495665 | -1292413 | -1730881 |
| 2003 | -0227273 | -0117382 | -044004 | -1381628 | -1184748 | -1611225 |
| 2004 | -0135501 | -0056066 | -0327484 | -1247148 | 1060296 | -1466929 |
| 2005 | -0298103 | 0163651 | -0543019 | -1027967 | -0861646 | -1226392 |
| 2006 | -0244499 | .0130565 | -0457853 | -1407884 | -1201826 | -1649272 |
| 2007 | -0176991 | -0087973 | .0356085 | -1404451 | -1203124 | -1639468 |
| 2008 | .0299252 | .0168524 | .0531388 | -1217082 | -1038434 | -1426463 |
| 2009 | 0172043 | -0085528 | -0346071 | -1190818 | -1013808 | -1398733 |
| 2010 | -0300429 | 0176544 | .0511248 | -105615 | -0896439 | -1244314 |
| 2011 | -0141414 | -0067065 | -0298187 | -0950729 | -0797911 | -1132814 |
| 2012 | -0148148 | -007371 | -0297761 | -1138647 | -0971601 | -1334413 |
| 2013 | .0145191 | -0072246 | .0291787 | -1069736 | -0907879 | -1260448 |
| 2014 | -0099174 | -0044378 | .0221627 | -1031417 | .0882385 | -1205619 |
| 2015 | -0048701 | -0015664 | -0151421 | -098938 | 0847797 | -1154606 |
Figure 1: Trends in Firearm data
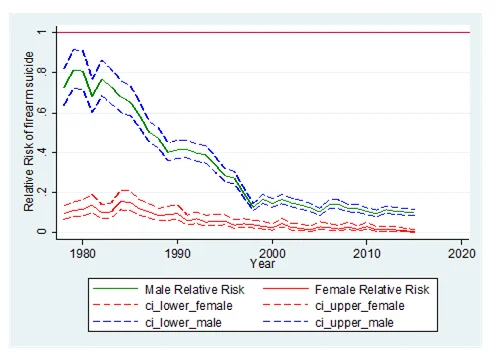
Figure 2: Analysis of firearm suicide in Both Genders
Problem Description:
Question 1: Analysis of Firearms Data
The assignment involves a comprehensive analysis of firearms data, with a focus on understanding the trends in relative risk (RR) for men over a specified period. The provided graph indicates a notable shift in RR around the year 1997, prompting an exploration into the potential factors contributing to this change.
Solution:
Based on the analysis, the levelling off of relative risk for men post-1997 can be attributed to several key factors:
- Changes in Firearm-related Policies:The implementation of stricter gun control measures or interventions targeting high-risk individuals likely contributed to the observed reduction in firearm-related mortality, leading to a stabilization in the relative risk.
- Public Awareness and Prevention Efforts:Increased awareness about the risks associated with firearms, coupled with efforts to promote safe firearm practices, may have played a significant role in reducing firearm-related deaths among men.
- Improved Mental Health Interventions: Enhanced access to mental health services and improved identification and treatment of mental health issues, often linked to firearm-related suicides, could have influenced the levelling off of the relative risk.
- Socioeconomic and Cultural Factors:Changes in socioeconomic conditions, cultural attitudes towards firearms, and shifts in societal norms regarding help-seeking behaviour are additional factors that may have contributed to the observed patterns.
Question 2: Analysis of Serum Creatinine Data
The second part of the assignment focuses on the analysis of serum creatinine data. Notable observations include two years, 1970 and 1971, exhibiting significantly lower mean creatinine levels compared to the surrounding years. The trajectory of creatinine levels in the subjects displays variability, with specific years showing distinct patterns.
Solution:
- 1970 and 1971 Creatinine Levels:In 1970, the mean creatinine level is recorded as .8545139, significantly lower than surrounding years. Similarly, in 1971, the mean creatinine level is .9178472, relatively lower compared to other years except for 1970.
- Variability in Creatinine Levels:The trajectory of creatinine levels ranges from .8545139 in 1970 to .9821724 in 1972. Levels in 1968, 1969, and 1973 fall within a similar range, ranging from .9601695 to .9709747. However, in 1971, there is a slight increase compared to 1970, and the levels continue to rise in 1972 before decreasing again in 1973.
This analysis provides insights into the variations in serum creatinine levels over the specified time frame, highlighting the importance of examining outliers and trends for a comprehensive understanding of the data.
Explore Our Samples
Explore our comprehensive array of sample assignments on Data Analysis, showcasing diverse methodologies, techniques, and case studies. Gain insights into statistical modeling, hypothesis testing, regression analysis, and more through our meticulously curated examples. Delve into real-world applications and sharpen your analytical skills with our extensive collection. Elevate your understanding and proficiency in Data Analysis with our rich repository of samples.
Data Analysis
Data Analysis
Data Analysis
Data Analysis
Statistics
Data Analysis
tableau
Data Analysis
Data Analysis
Data Analysis
Data Analysis
Data Analysis
Data Analysis
R Programming
Data Analysis
Data Analysis
Data Analysis
Data Analysis
Data Analysis
Data Analysis