Assignment Solution: Statistical Analysis and Hypothesis Testing

- Problem Description: First Generation College Students
- Steps:
- 1. Hypotheses:
- 2. Randomization Distribution:
- 3. P-Value Calculation:
- 4. Decision:
- 5. Conclusion:
- Question Set 1_C:
- Problem Description: Credit Card Fraud Detection
- Hypotheses:
- Question Set 2_B: Type I Error:
- Question Set 2_C: Type II Error:
- Question Set 2_D: Severity Comparison:
- Question Set 2_E: Alpha Level Choice:
- Reflection:
Problem Description: First Generation College Students
Question Set 1_A: Research Question: Do more than 25% of all World Campus students identify as first-generation students?
Steps:
.webp)
Figure 0.1: Randomization test for a proportion
1. Hypotheses:
- Null Hypothesis:0.25H0:P≤0.25
- Alternative Hypothesis:0.25HA:P0.25
2. Randomization Distribution:
- Use StatKey to construct a randomization distribution with at least 5000 resamples.
3. P-Value Calculation:
- According to StatKey, the p-value is 0.935 in a right-tailed test.
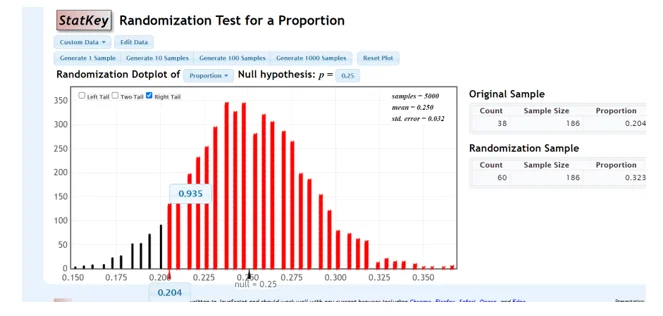
Figure 2: Using StatKey to construct a randomization distribution
4. Decision:
- Since the p-value significance level, fail to reject the null hypothesis.
5. Conclusion:
- We lack sufficient evidence to support the claim that more than 25% of all World Campus students identify as first-generation students.
Question Set 1_C:
- Compare results from parts 1_A and 1_B.
- Explain why the p-value changed with the increase in sample size.
- The p-value changed due to the larger sample size providing more precise estimates of the population proportion, resulting in a narrower distribution around the hypothesized proportion.
Problem Description: Credit Card Fraud Detection
Question Set 2_A: Research Question: Does the new AI technology detect fraudulent charges more than 97% of the time?
Hypotheses:
- Null Hypothesis: 0.97H0:P≤0.97
- • Alternative Hypothesis: 0.97HA:P 0.97
Question Set 2_B: Type I Error:
- Falsely rejects the null hypothesis, indicating the technology detects fraud more than 97% when it does not.
- Consequence: Wasting resources and implementing an ineffective system.
Question Set 2_C: Type II Error:
- Fails to reject the null hypothesis, suggesting the technology does not detect fraud more than 97% when it does.
- Consequence: Missing the chance to enhance fraud detection and exposing customers to fraudulent activity.
Question Set 2_D: Severity Comparison:
- In this scenario, a Type II error is more serious. Failing to invest in the new technology could lead to continued losses from fraudulent charges and potential harm to customers.
Question Set 2_E: Alpha Level Choice:
- Given the consequences, a lower alpha level (e.g., 0.05) is recommended to reduce the likelihood of Type II error.
Reflection:
- Confidence Level:High confidence in answers grounded in provided information and hypothesis testing principles.
- Challenges:Determining the severity of errors in the specific context was the most challenging aspect.
Related Samples
Step into our sample section, where statistical principles come to life through a diverse array of examples. From hypothesis testing to time series analysis, each sample is tailored to deepen your understanding and hone your skills. Explore practical applications and gain valuable insights into the world of statistics. Let our curated samples be your stepping stones to success in data analysis and interpretation.
Statistical Analysis
Statistical Analysis
Statistical Analysis
Statistical Analysis
Statistical Analysis
Statistical Analysis
Statistical Analysis
Statistical Analysis
STATA
Statistical Analysis
Statistics
Statistical Analysis
Statistical Analysis
SAS
R Programming
Statistical Analysis
Statistical Analysis
Statistics
Statistical Analysis
SPSS