In our quest to enhance research acumen, the assignment on statistical decision-making and research reporting plays a pivotal role. This exercise delves into the intricate relationship between research questions, variables, data types, and the choice of appropriate statistical analyses, offering valuable insights into the world of statistical analysis. Beyond these technical aspects, it also underscores the significance of understanding and overcoming anxiety surrounding statistics. By navigating this terrain, students develop not only statistical skills but also the confidence to approach data analysis with competence, ultimately mitigating the anxiety often associated with this crucial aspect of research.
Problem Description
In statistical analysis assignment, we delve into the realm of statistical analysis and research reporting, exploring the critical connection between research questions, variables, data types, levels of variables, and the appropriate statistical analysis methods. This exercise is designed to enhance our understanding of the intricacies of conducting research and interpreting results.
Section Two: Statistical Analysis and Research Reporting
Statistics Decision Making
To effectively tackle the assignment, you need to answer questions such as what the independent and dependent variables are, the type of data, and the levels of the independent variables, all while determining the most suitable statistical analysis methods based on given parameters. This task demands a deep study of statistics and research methodologies. Below, you'll find a sample solution:
Research Question: Do those who hold a conspiracy mentality and paranormal beliefs have a higher likelihood of engaging in COVID conspiracy thinking?
- Design (within/ between): Between-subjects design
- Independent Variable(s) (IV): Conspiracy Mentality
- Levels of IV: One level: conspiracy mentality
- Dependent Variable(s) (DV): Covid conspiracy thinking
- Proposed Test: Chi-Square Analysis
Explanation: In this scenario, we are assessing the relationship between conspiracy mentality and the inclination to engage in COVID conspiracy thinking. A Chi-Square Analysis is appropriate, as it is used to determine the independence or association between two categorical variables, which is the case here.
3: Data Analysis and Write-Up
Set One: Predicting Binge Drinking
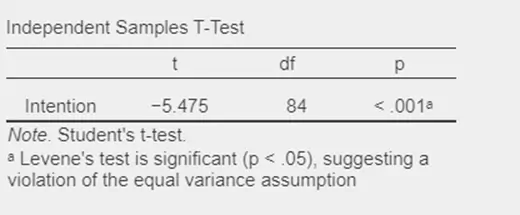
1) The question is whether there is a difference between people who engaged in binge drinking in the past and people who have not with regard to level of future intention to binge drink.
Solution:
- Alternative Hypothesis (H1): There is a significant difference between those who have engaged in binge drinking in the past and those who have not on levels of future intention to binge drink.
- Null Hypothesis (H0): There is no significant difference between those who have engaged in binge drinking in the past and those who have not on levels of future intention to binge drink.

Table 1: independent sample t-test analysis
| Group Descriptives. | |||||
|---|---|---|---|---|---|
| Group | N | Mean | SD | SE | Coefficient of variation |
| Intention No | 50 | 2 187 | 1873 | 0 265 | 0 856 |
| Yes | 36 | 4.667 | 2.323 | 0.387 | 0.498 |
Table 2: Group Descriptives
Interpretation: A statistical analysis was conducted using an independent samples t-test to compare the future intention to binge drink between those with and without a history of binge drinking. The results indicated a significant difference, and we accept the alternative hypothesis while rejecting the null hypothesis.
2) Levels of previous binge drinking, attitude, social norm, and self-efficacy significantly predict future intention to binge drink?
Solution:
- Alternative Hypothesis (H1): The levels of previous binge drinking, attitude, social norm, and self-efficacy have a significant effect on future intention to binge drink.
- Null Hypothesis (H0): The levels of previous binge drinking, attitude, social norm, and self-efficacy do not have a significant effect on future intention to binge drink.

Table 3: Model Summary

Table 4: ANOVA Testing

Table 5: Coefficients
Interpretation: A multiple regression analysis was employed to assess the impact of previous binge drinking, attitude, social norm, and self-efficacy on future intention to binge drink. The results demonstrated a significant effect of attitude and self-efficacy, and the overall model predicted a substantial proportion of variance in intention. We accept the alternative hypothesis and reject the null hypothesis.
Set Two: Implicit Association Test
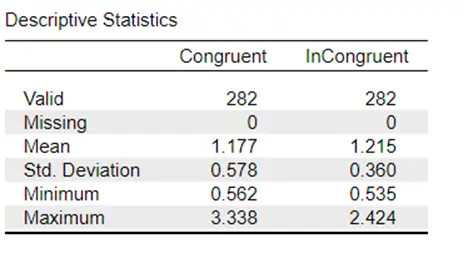
1) Is there a significant difference between congruent and incongruent reaction times?
Solution:
- Alternative Hypothesis (H1): There is a significant difference between congruent and incongruent reaction times.
- Null Hypothesis (H0): There is no significant difference between congruent and incongruent reaction times.

Table 6: Descriptive statistics
Interpretation: The paired sample t-test was used to compare congruent and incongruent reaction times, and the results indicated no significant difference. Therefore, we accept the null hypothesis.
2) The question here is whether there is an interaction between ethnicity and implicit association and whether the interaction is significant.
Solution:
- Alternative Hypothesis (H1): There is a significant interaction between ethnicity and implicit association.
- Null Hypothesis (H0): There is no significant interaction between ethnicity and implicit association.

Table: Frequencies for GenderCat

Table: Frequencies for Ethnicity
Interpretation: A chi-square test was performed to evaluate the association between gender category and ethnicity. The results revealed a significant association between the two variables, indicating that ethnicity and gender category are not independent of each other.
This assignment required an understanding of statistical analysis and research reporting skills, including the ability to identify the appropriate statistical tests and interpret their results.
Related Samples
Explore a wealth of examples on various statistical topics here! Our sample section offers a diverse range of statistical assignments to aid your understanding. Dive into real-life scenarios and solutions, perfect for reinforcing your statistical skills. Whether you're a beginner or an expert, there's something for everyone to learn and explore.
Statistics
Statistics
Statistics
Statistics
Statistics
Statistics
Statistics
Statistics
Statistics
Statistics
Statistics
Statistics
Statistics
Statistics
Statistics
Statistics
Statistics
Statistics
Statistics
Statistics
