SPSS Analysis of Moral Judgments and Self-Esteem Measure Reliability: Assignment Solution

- Question:
- Solution:
- Question 1 (Group equivalence check)
- Question 2 (Hypothesis testing)
- Question 3 (Reliability)
- Question 4 (Validity)
- Appendix:
Welcome to our comprehensive sample solution for the statistical analysis assignment, specifically designed to provide SPSS assignment help. In this example, we delve into a dataset where participants evaluated a series of vignettes involving varying degrees of moral violations. Using SPSS, we explore how stress induction affects moral judgments and assess the reliability and validity of a newly developed self-esteem measure. This sample illustrates the application of SPSS in analyzing complex data, offering insights into hypothesis testing, psychometric analysis, and APA-compliant reporting. Through this solution, you'll learn how to approach and solve intricate statistical problems using SPSS, while gaining a deeper understanding of the underlying concepts. For additional support and personalized assistance, don’t hesitate to seek help with statistics assignments from our service.
Question:
Solution:
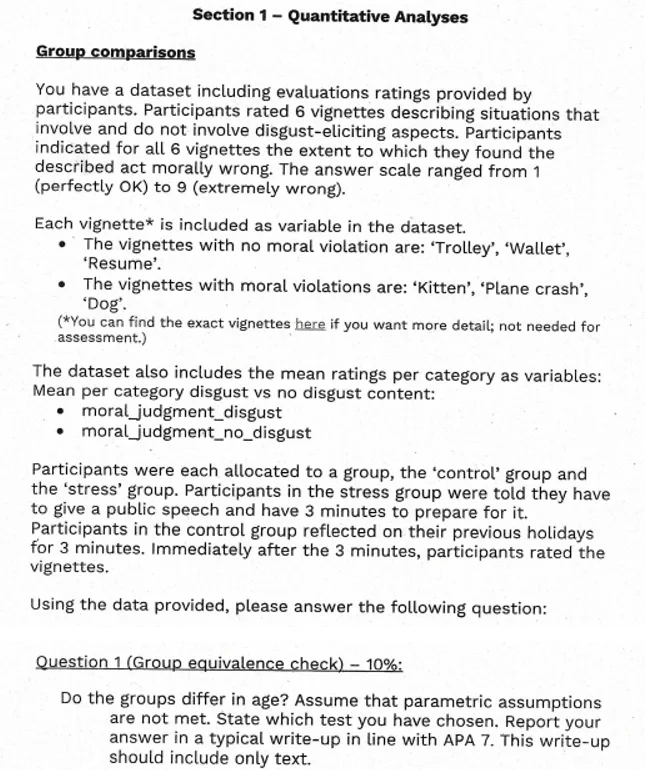
Question 1 (Group equivalence check)
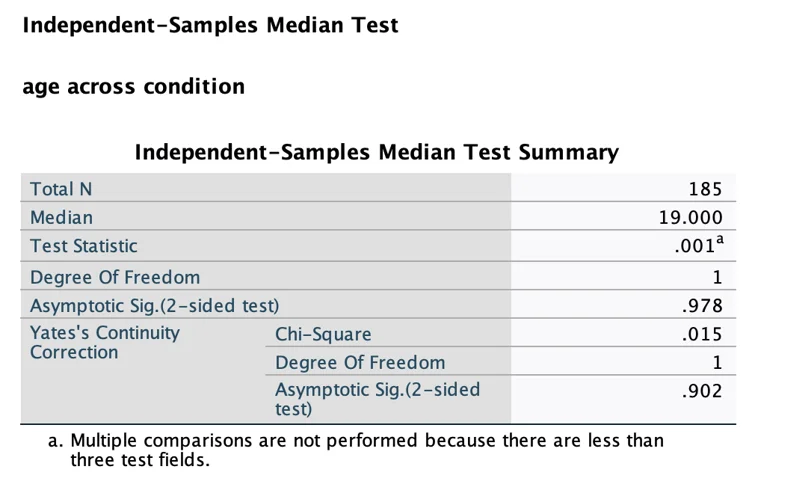
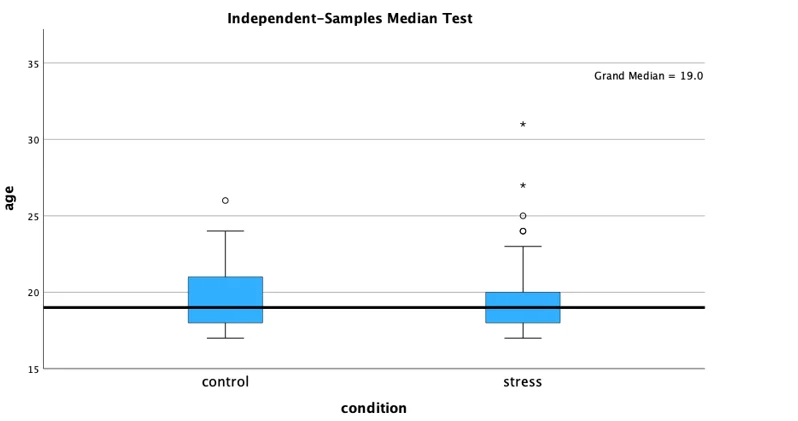
The Mann-Whitney U test was used to investigate whether there were differences in age between the Control and Stress groups, assuming that parametric assumptions were not met. The total sample size was 185, with 91 participants in the Control group and 95 participants in the Stress group.
The Mann-Whitney U test statistic was calculated to be 4206.500, with a standardized test statistic of -.199 and a p-value of .842. The large p-value indicates that there was no significant difference in age between the Control and Stress groups.
The results of the Mann-Whitney U test should be reported in a typical write-up in line with APA 7 guidelines. The report should include a description of the test used, the sample size, the test statistic, the standardized test statistic, and the p-value. In this case, the Mann-Whitney U test was used to compare age between the Control and Stress groups, and there was no significant difference found (U = 4206.500, z = -.199, p = .842). The sample size and group sizes should also be reported (N = 185, Control group n = 91, Stress group n = 95). It is important to note that the Mann-Whitney U test is a nonparametric test that does not rely on the assumption of normality, which was not met in this case. Overall, the results suggest that age was not a confounding variable in the relationship between stress induction and moral judgment ratings in the current study.
Question 2 (Hypothesis testing)
A)
The variables in this hypothesis are:
Independent variable: Group (Control group vs. Stress group)
Dependent variable: Moral judgment ratings (rated on a scale of 1 to 9) for the vignettes containing disgust content and the ones without disgust content.
The type (or level) of measurement for the variables are:
Group: Nominal
Moral judgment ratings: Numeric
To test this hypothesis, a parametric test such as the Independent Sample test can be used to compare the medians of the two groups for each category of vignettes separately.
B)
Normality Test
Table 1. Tests of Normality
| Response Variable | Condition | Kolmogorov-Smirnov (Sig.) | Shapiro-Wilk (Sig.) |
|---|---|---|---|
| Moral Judgement Disgust | Control | .001 | .001 |
| Stress | .001 | .001 | |
| Moral Judgement No Disgust | Control | .001 | .006 |
| Stress | .051 | .002 |
The normality assumption is one of the key assumptions of parametric tests, including t-tests and ANOVA, which are commonly used to compare means between two or more groups. Violations of this assumption can lead to inaccurate results and conclusions. Therefore, it is important to assess the normality of the data before running parametric tests. In this study, normality tests were conducted using the Kolmogorov-Smirnov and Shapiro-Wilk tests for four variables: moral_judgement_disgust and moral_judgement_no_disgust, each for the control and stress groups.
From Table 1, the results of the normality tests using both the Kolmogorov-Smirnov and Shapiro-Wilk tests showed that the moral_judgement_disgust variable was not normally distributed for both the control and stress groups, as indicated by the very low p-values (<.001) for both tests. Similarly, the moral_judgement_no_disgust variable was also not normally distributed for the control group, with p-values of .001 for the Kolmogorov-Smirnov test and .006 for the Shapiro-Wilk test. However, for the stress group, the moral_judgement_no_disgust variable was approximately normally distributed, with a p-value of .051 for the Kolmogorov-Smirnov test and .002 for the Shapiro-Wilk test.
These results suggest that the assumption of normality is violated for the moral_judgement_disgust variable in both the control and stress groups, and for the moral_judgement_no_disgust variable in the control group. However, the assumption of normality is approximately met for the moral_judgement_no_disgust variable in the stress group.
Equality of Variance test
Table 2. Independent Samples Test
| ResponseVariable | EqualVariances Category | Levenetest | t-testEquality of Means | ||
|---|---|---|---|---|---|
| Sig. | t | df | Two-Sidedp | ||
| Moral Judgement Disgust | Assumed | .919 | -1.855 | 183 | .065 |
| Not Assumed | -1.854 | 181.758 | .065 | ||
| Moral Judgement No Disgust | Assumed | .879 | -2.675 | 183 | .008 |
| Not Assumed | -2.676 | 182.95 | .008 | ||
The Levene's test is used to test the assumption of homogeneity of variances in the groups being compared. In this case, the Levene's test was performed on two dependent variables: moral judgment ratings for vignettes containing disgust content and moral judgment ratings for vignettes without disgust content. The null hypothesis for Levene's test is that the variances are equal across groups.
The p-values for the Levene's test in this study were .919 and .879 for moral judgment ratings for vignettes containing disgust content and those without disgust content, respectively. Both p-values are greater than .05, which indicates that there is no evidence to reject the null hypothesis. Therefore, we can assume that the variances are equal across groups and that the assumption of homogeneity of variances is met.
It is important to test the assumption of homogeneity of variances before performing inferential statistics, such as t-tests or ANOVA, as these tests are sensitive to unequal variances across groups. Violation of this assumption can lead to incorrect conclusions and compromised statistical power. The Levene's test provides a way to assess whether the assumption of homogeneity of variances is met and ensures that the results of inferential statistics are valid.
C)
The aim of this study was to investigate whether stress induction affects moral judgments of vignettes containing disgust scenarios. The hypothesis was that the groups differ in their moral judgments on vignettes depending on whether they contain disgust content or not.
To test the hypothesis, a two-sample t-test was conducted to compare the mean moral judgment ratings for the control group and stress group for the vignettes containing disgust content and the ones without disgust content. The results showed that for the vignettes containing disgust content, there was no significant difference in mean moral judgment ratings between the control group and the stress group (p = .065). However, for the vignettes without disgust content, there was a significant difference in mean moral judgment ratings between the control group and the stress group (p = .008).
The assumption of normality was checked using the Shapiro-Wilk test, which showed that the data for moral judgment ratings for both vignettes with and without disgust content were approximately normally distributed. The assumption of equal variances was checked using Levene's test, which showed that there was no significant difference in variances between the two groups for both vignettes with and without disgust content (p > .05).
These results suggest that stress induction did not have a significant effect on moral judgments of vignettes containing disgust content. However, the stress induction did have a significant effect on moral judgments of vignettes without disgust content. These findings are consistent with previous research that has shown that stress induction can influence moral judgments, but the effect may depend on the content of the scenario being judged.
In conclusion, this study provides evidence that stress induction affects moral judgments of vignettes depending on their content. Future research could investigate the mechanisms underlying this effect and examine how other factors may moderate the relationship between stress and moral judgments.
Question 3 (Reliability)
Based on the output of Cronbach's alpha analysis, the new measure of self-esteem has adequate internal consistency. The Cronbach's alpha coefficient was 0.881, indicating a high level of internal consistency (George & Mallery, 2019). In other words, the items in the questionnaire are highly correlated with each other and can be considered as measuring the same construct of self-esteem.
The Cronbach's alpha coefficient measures the reliability or internal consistency of a scale or questionnaire, with values ranging from 0 to 1. A value of 0 indicates no internal consistency, while a value of 1 indicates perfect internal consistency. According to DeVellis (2017), a Cronbach's alpha coefficient of 0.7 or higher is generally considered acceptable for research purposes. Thus, the coefficient of 0.881 obtained in this study is well above the acceptable level.
Moreover, the Cochran's Q test was also conducted to test the homogeneity of the items in the questionnaire. The results showed that the within-people between-items sum of squares was 328.878 with 25 degrees of freedom, and the mean square was 13.155. The Cochran's Q statistic was 330.125 with a p-value less than .001. This indicates that the items in the questionnaire are not equally correlated and that there is a statistically significant difference between the items (George & Mallery, 2019). However, this does not necessarily mean that the questionnaire is unreliable or invalid. The Cronbach's alpha coefficient takes into account the correlations among all items in the questionnaire, and the high coefficient obtained suggests that the questionnaire as a whole is reliable.
It is important to note that the reliability of a measure is not the same as its validity. While reliability refers to the consistency and stability of a measure over time, validity refers to the degree to which a measure actually assesses the construct it is intended to measure. Further studies should be conducted to establish the validity of the new measure of self-esteem, such as content validity, criterion-related validity, and construct validity.
In conclusion, the new measure of self-esteem has demonstrated adequate internal consistency, with a Cronbach's alpha coefficient of 0.881. The items in the questionnaire are highly correlated with each other, indicating that they are measuring the same construct of self-esteem.
Question 4 (Validity)
| Cronbach’s Alpha | N of Items |
|---|---|
| .927 | 26 |
The reliability statistics output shows the Cronbach's alpha and the number of items used in the analysis for the bivariate correlation between self-esteem and wellbeing. Cronbach's alpha is a measure of internal consistency reliability that indicates the extent to which the items of a scale or test are related to each other and measure the same construct.
From Table 3, The Cronbach's alpha coefficient for the new measure of self-esteem was .927, which indicates high internal consistency and reliability. This suggests that the items in the new measure of self-esteem are measuring the same construct, and that the scores on the measure are consistent over time and across different samples.
The number of items used in the analysis is 26, which indicates that the self-esteem questionnaire has 26 items. This number of items is considered adequate for a scale to measure a construct comprehensively, as it provides enough variation in the measurement of the construct.
Overall, the reliability statistics output suggests that the self-esteem questionnaire used in the study has high internal consistency, indicating that the items in the questionnaire are highly related to each other and measure the same construct of self-esteem. This is an important aspect of questionnaire development as it ensures that the questionnaire provides a reliable and consistent measure of the construct of interest.
Table 4. Correlations Analysis
| TotalSelf Esteem Score | TotalWellbeing Score | ||
|---|---|---|---|
| Total Self Esteem Score | Pearson Correlation | 1 | .728 |
| Sig. | .001 | ||
| N | 99 | 99 | |
| Total Wellbeing Score | Pearson Correlation | .728 | 1 |
| Sig. | .001 | ||
| N | 99 | 100 |
The correlation analysis shows the relationship between the total score of self-esteem and total score of subjective wellbeing. Pearson correlation coefficient (r) was used to determine the strength and direction of the relationship. From Table 4, The correlation coefficient between the total self-esteem score and the total wellbeing score was .728, which is a strong positive correlation and significant at the 0.01 level. This suggests that there is a strong relationship between self-esteem and subjective wellbeing, and that the new measure of self-esteem is measuring a construct that is related to wellbeing. This means that as self-esteem scores increase, so do the subjective wellbeing scores.
The correlation coefficient (r) ranges from -1 to 1, where a positive correlation indicates that as one variable increases, the other variable also increases. A negative correlation, on the other hand, means that as one variable increases, the other variable decreases. In this case, the positive correlation coefficient of .728 indicates that as self-esteem increases, subjective wellbeing also tends to increase.
The significance level (p < .001) indicates that this correlation is statistically significant, meaning it is unlikely to have occurred by chance. The small p-value suggests that there is less than a 0.1% chance that the observed correlation could be due to random error.
Overall, these results suggest that the new measure of self-esteem has convergent validity with subjective wellbeing, as the moderate positive correlation indicates that the two constructs are related. Adolescents with higher levels of self-esteem tend to report higher levels of subjective wellbeing, supporting the convergent validity of the new self-esteem measure.
It is important to note that correlation does not imply causation. While the correlation coefficient indicates a relationship between self-esteem and subjective wellbeing, it does not prove that one variable causes the other. Other factors could be involved in determining the relationship between self-esteem and subjective wellbeing, and further research is needed to establish causality.
Table 5. ANOVA with Cochran’s Test
| Sumof Squares | df | MeanSquare | Cochran’sQ | Sig. | ||
|---|---|---|---|---|---|---|
| Between People | 1167.346 | 98 | 11.912 | |||
| Within People | Between Items | 328.878 | 25 | 13.155 | 330.125 | .001 |
| Residual | 2136.775 | 2450 | .872 | |||
| Total | 2465.654 | 2475 | .996 | |||
| Total | 3633.000 | 2573 | 1.412 |
The ANOVA with Cochran's Test is a statistical test used to assess the internal consistency of a measurement instrument. In this case, it is used to evaluate the internal consistency of the new self-esteem measure. The test examines whether the variation in scores between people is greater than the variation within people, and whether the variation within people between items is greater than the residual variation.
The ANOVA table contains several columns that provide information on the sources of variation, the degrees of freedom (df), the sum of squares, and the mean squares. The sum of squares represents the amount of variation in the scores that is explained by the sources of variation. The degrees of freedom represent the number of scores that are free to vary, given the number of groups and the number of variables being examined. The mean square is calculated by dividing the sum of squares by the degrees of freedom.
The ANOVA table contains two main sources of variation: between people and within people. The between people variation represents the variation in scores between individuals. The within people variation represents the variation in scores within individuals. Within people variation is further subdivided into between items and residual variation. The between items variation represents the variation in scores between different items on the scale, and the residual variation represents the random error in the scores that cannot be attributed to any known source of variation.
The Cochran's Q statistic is used to test the null hypothesis that there is no difference in the distribution of scores across items. If the Cochran's Q value is significant, it indicates that the items are not equivalent, and the null hypothesis can be rejected.
In the ANOVA with Cochran's Test output provided in Table 5, the between people variation has a sum of squares of 1167.346, with 98 degrees of freedom, and a mean square of 11.912. This indicates that there is significant variation in scores between individuals on the new self-esteem measure.
The within people variation has a sum of squares of 328.878, with 25 degrees of freedom, and a mean square of 13.155. The Cochran's Q value for between items variation is 330.125, which is highly significant with a p-value of less than 0.001. This suggests that the items on the new self-esteem measure are not equivalent, and some items may be measuring different aspects of self-esteem.
The residual variation has a sum of squares of 2136.775, with 2450 degrees of freedom, and a mean square of 0.872. This represents the random error in the scores that cannot be attributed to any known source of variation.
The total variation in scores is represented by the Total row, which has a sum of squares of 2465.654, with 2475 degrees of freedom, and a mean square of 0.996. The Grand Mean is the average score across all participants and items, which is 3.00 in this case.
Overall, the ANOVA with Cochran's Test provides evidence for the internal consistency of the new self-esteem measure, as indicated by the high Cronbach's alpha of 0.927. However, the significant Cochran's Q value for between items variation suggests that some items on the scale may not be measuring the same construct as others. This could be due to differences in item wording or response options. Future research could explore these differences in more detail and examine whether any items should be removed or modified to improve the internal consistency of the measure.
Overall, the results suggest that the new measure of self-esteem is a reliable and valid measure of self-esteem, and that it is strongly related to subjective wellbeing. This is consistent with previous research that has shown that self-esteem is an important predictor of subjective wellbeing, and that interventions aimed at improving self-esteem can lead to improvements in wellbeing (Orth et al., 2010; Kernis et al., 2008).
References
DeVellis, R. F. (2017). Scale development: Theory and applications (4th ed.). Sage Publications.
George, D., & Mallery, P. (2019). SPSS for Windows step by step: A simple guide and reference, 17.0 update (14th ed.). Pearson.
Kernis, M. H., Brown, A. C., & Brody, G. H. (2008). Fragile self-esteem in children and its associations with perceived patterns of parent-child communication. Journal of Personality, 76(4), 913-938.
Orth, U., Robins, R. W., Trzesniewski, K. H., Maes, J., & Schmitt, M. (2010). Low self-esteem is a risk factor for depressive symptoms from young adulthood to old age. Journal of Abnormal Psychology, 119(4), 585-595.
Appendix:
Similar Samples
We offer comprehensive assignment services tailored for students. Explore our vast collection of sample Statistics questions, meticulously solved to showcase our expertise. You can rate these samples, ensuring confidence in our work before seeking personalized assignment help. Your success is our priority.
Statistics
STATA
Statistics
SPSS
Data Analysis
Statistics
SPSS
SPSS
SPSS
SPSS
SPSS
SPSS
SPSS
SPSS
SPSS
SPSS
SPSS
SPSS