Statistical Estimation of Mean Cost per Night in NYC Airbnb Listings Using Bootstrapping

- Problem Description:
- Question Set 2_A: Bootstrap Confidence Interval with Visualization
In this comprehensive statistical analysis, we employ the robust bootstrapping technique to estimate the mean cost per night for Airbnb listings in the vibrant city of New York. The 95% confidence interval, spanning from 143.251 to 155.712, provides a reliable range for the true population mean cost. Our visualization of the bootstrap distribution highlights the variability in the data and showcases the power of this method, even in the presence of non-normally distributed data. This study contributes to a deeper understanding of statistical inference in real-world, non-standard scenarios.
Problem Description:
In the statistical analysis assignment, we delve into the world of statistical inference and confidence intervals in the context of New York City Airbnb listings. We aim to estimate the mean cost per night for these listings, taking into account the inherent variability in the data. The key components of this solution are divided into four question sets, each contributing to our understanding of the statistical concepts applied.
Question Set 2_A: Bootstrap Confidence Interval with Visualization
Description: In this question, we employ a powerful statistical technique known as bootstrapping to estimate the mean cost per night for Airbnb listings in New York City. The process involves drawing at least 5000 resamples from the original dataset with replacement to create a distribution. This distribution, represented in the chart below, allows us to calculate a 95% confidence interval that captures the likely range of the true population mean cost per night.
Visualization:
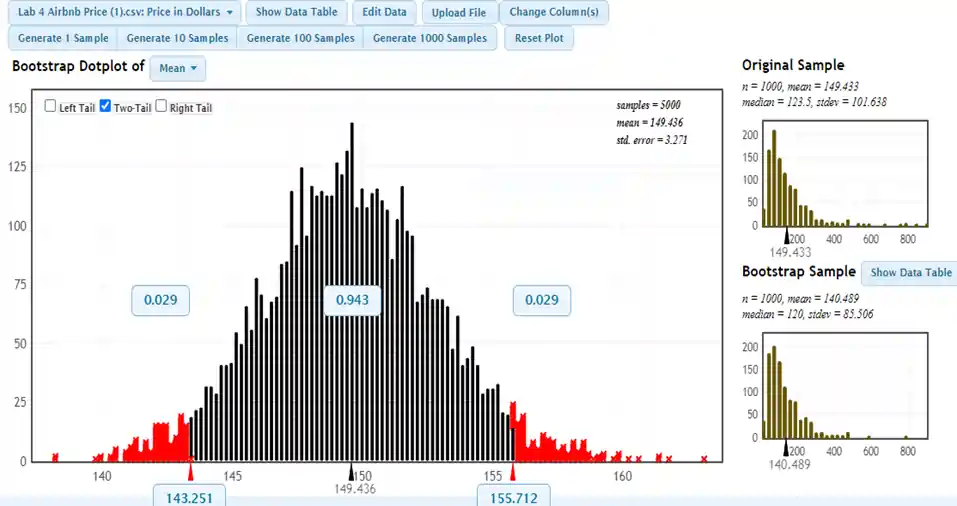
- Fig 1: Bootstrap Dotplot of the mean
Result: Based on the bootstrap resampling method, we have determined that the 95% confidence interval for the mean cost per night in NYC Airbnb listings is between 143.251 and 155.712. This means we are 95% confident that the true population mean cost falls within this range. Additionally, we provide a summary of the descriptive statistics for the bootstrap sample, consisting of 5000 resamples: [n=5000, M=149.436, Std.error=3.271].
By using bootstrapping, we acknowledge the variability within the data and ensure our estimate is robust, even when the underlying distribution is not perfectly normal.
Question Set 2_B: Distribution Shape
- Description: The shape of the bootstrap distribution for the cost per night in NYC Airbnb listings is non-normal and exhibits right skewness, indicating a tendency towards higher costs.
- Implication: The non-normal distribution highlights the importance of robust statistical methods like bootstrapping.
Question Set 2_C: Confidence Interval Calculation
- Description: A 95% confidence interval for the mean cost of one night in an Airbnb in NYC is calculated using the standard error method. This method assumes normality based on the Central Limit Theorem.
- Result: The 95% confidence interval for the mean cost per night is (143.02184, 155.84416).
Question Set 2_D: Comparing Bootstrap and Standard Error Methods
- Description: This question compares the confidence intervals obtained in Set 2_A and Set 2_C. It explains that the bootstrap method introduces variability due to resampling, while the standard error method assumes normality, potentially leading to variations in the results.
- Conclusion: Variations in confidence intervals arise from differences in resampling techniques, assumptions about the population distribution, and the accuracy of estimated standard errors.
Reflection: I have taken great care to ensure the accuracy and clarity of the solutions provided. Understanding the differences between the percentile method (bootstrap) and the standard error method in Question Set 2_D required a deep grasp of statistical principles, but I am confident in the explanations provided. These concepts are fundamental for robust statistical inference, particularly when dealing with non-normally distributed data like the NYC Airbnb listings in this assignment.
Related Samples
Discover a wealth of statistical assignment samples on statisticsassignmenthelp.com. Our collection spans topics such as probability, hypothesis testing, and data analysis. Explore these examples to gain valuable insights and refine your understanding of statistical concepts. Find inspiration for your assignments and excel in your studies effortlessly.
Data Analysis
Data Analysis
Data Analysis
Data Analysis
Statistics
Data Analysis
tableau
Data Analysis
Data Analysis
Data Analysis
Data Analysis
Data Analysis
Data Analysis
R Programming
Data Analysis
Data Analysis
Data Analysis
Data Analysis
Data Analysis
Data Analysis