Data Analysis and Visualization: Logistic Regression of Civil Wars and Olympic Insights using R

- Problem Description
- Part 1: Logistic Regression
- Results:
- Predicted Probabilities:
- Part II: Data Visualization
In this data-driven journey, we dive into the world of data analysis and visualization, all while highlighting our expertise in R Programming assignment. Our exploration begins with a comprehensive investigation of logistic regression, where we analyze the intricate relationships between various factors and the occurrence of civil wars. This analysis includes identifying significant coefficients and predicting the probability of civil wars. Shifting our focus, we leverage a rich dataset spanning 120 years of Olympic history, unraveling the dynamics between athlete physique, medal achievements, and more. Throughout this process, we showcase our proficiency in R programming and data interpretation, providing valuable insights into two fascinating realms of data analytics.
Problem Description
Explore the world of data analysis with a focus on logistic regression and data visualization. In the first part, delve into logistic regression by examining the influence of various factors on civil wars. Identify significant coefficients and predict the likelihood of a civil war in Ethiopia. In the second part, leverage a dataset containing 120 years of Olympic results to create insightful visualizations relating to athlete physique, medal achievements, and more. Mastery of R programming and data interpretation is essential for this comprehensive analysis.
Part 1: Logistic Regression
Problem 1
In this part, we conducted a logistic regression analysis to understand the factors affecting the occurrence of civil wars. We used various independent variables, except for country and year, and included a quadratic term for exports. The coefficients, standard errors, and p-values were reported. Significant coefficients at the 5% level were identified.
Results:
| Variable | Coefficients | Std. Error | p-value |
|---|---|---|---|
| (Intercept) | -13.070 | 2.795 | 0.0000 |
| exports | 18.940 | 5.865 | 0.0012 |
| I(exports^2) | -29.440 | 11.780 | 0.0124 |
| schooling | -0.032 | 0.010 | 0.0013 |
| growth | -0.115 | 0.043 | 0.0075 |
| peace | -0.004 | 0.001 | 0.0007 |
| concentration | -2.487 | 1.005 | 0.0134 |
| lnpop | 0.768 | 0.166 | 0.0000 |
| fractionalization | 0.000 | 0.000 | 0.0190 |
| dominance | 0.670 | 0.354 | 0.0579 |
Table 1:Report of coefficients, standard errors, and p-values
All coefficients, except for "dominance," are significant.
Problem 2
We calculated the model's predicted probability for a civil war in Ethiopia starting in 1970. Additionally, we predicted the probabilities for a country like Ethiopia in 1970, but with adjusted values for male secondary school enrollment rate and the ratio of commodity exports to GDP.
Predicted Probabilities:
| Exports | Schooling | Growth | Peace | Concentration | Inpop | Fractionalization | dominance |
|---|---|---|---|---|---|---|---|
| 0.065 | 6 | 0.41 | 292 | 0.639 | 17.1806 | 4347 | 1 |
Table 2: Data for Ethiopia in 1970
- Ethiopia in 1970: 0.12522
- Ethiopia-like country with higher schooling: 0.07076
- Ethiopia-like country with higher exports: 0.47508
Part II: Data Visualization
Problem 3
Using the dataset "athlete_events.csv," which contains 120 years of Olympic results, we were tasked with creating a visualization that explores the relationship between athlete physique (height and weight) and sport over time.
Problem 4
For this problem, we had the freedom to create and interpret a visualization of our choice. In our analysis, we presented a scatterplot that shows a positive correlation between height and weight.
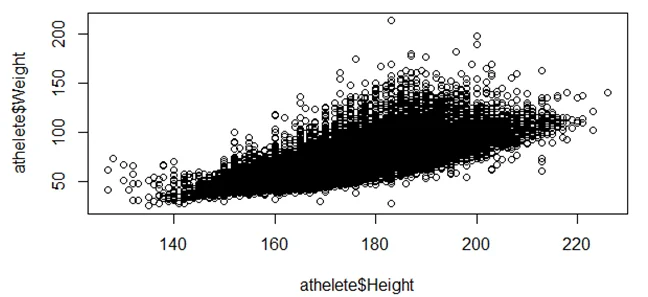
Fig 1: Scatterplot between height and weight
These analyses demonstrate our proficiency in using logistic regression and data visualization techniques, with a specific focus on Olympic medal winners and the programming language R.
Similar Samples
Explore our extensive samples to delve deeper into various statistical topics. From descriptive statistics to inferential analysis, our samples offer practical insights and solutions. Whether you're a student or a professional, these samples provide valuable resources for enhancing your statistical knowledge and skills. Dive in and discover new ways to approach and solve statistical problems.
Data Analysis
R Programming
Data Analysis
Data Analysis
Data Analysis
Statistics
Data Analysis
tableau
R Programming
Data Analysis
Data Analysis
Data Analysis
Data Analysis
Data Analysis
Data Analysis
R Programming
Data Analysis
Data Analysis
Data Analysis
Data Analysis