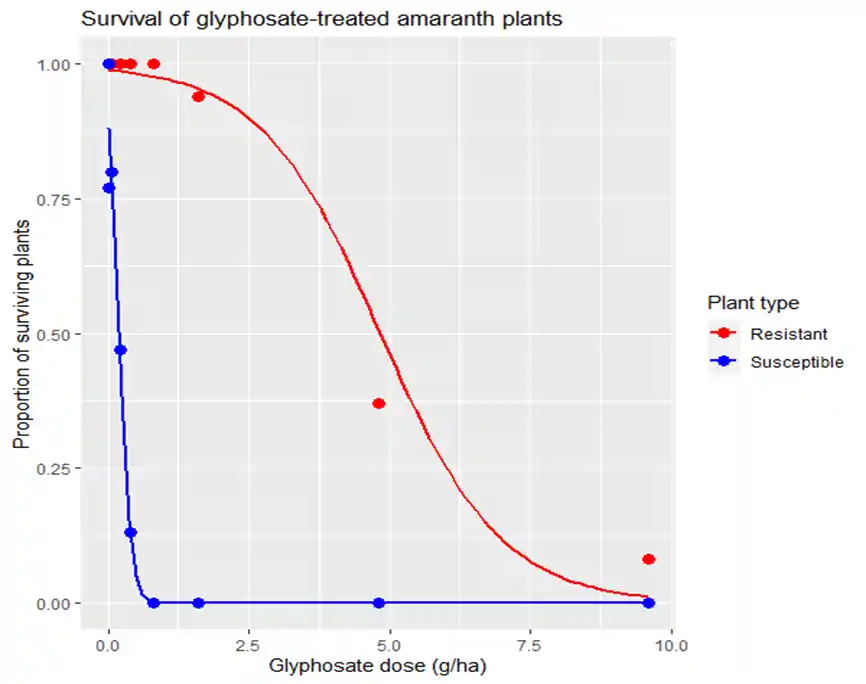
In this in-depth analysis, we delve into the intricate relationship between glyphosate, a commonly used herbicide, and two distinct populations of Amaranthus Tuberculatus—resistant and susceptible. Through rigorous statistical modeling, we uncover their divergent responses to glyphosate exposure, shedding light on how resistant plants exhibit higher LD50 values, indicating reduced susceptibility. These findings emphasize the critical importance of monitoring herbicide resistance and its potential implications for sustainable weed management and agriculture.
Problem Description
The data analysis assignment required an analysis of the effects of glyphosate, a commonly used herbicide, on the survival of both resistant and susceptible populations of Amaranthus tuberculatus, a weed species. The primary focus was on estimating LD50 values (the glyphosate concentration at which 50% of the plants would die within 21 days) for the two populations and examining how they responded differently to the herbicide. The analysis involved logistic regression models and statistical inferences.
Analysis of Resistant Population
Statistical Model: The statistical model for the logistic regression curve fitted for the resistant plants is as follows: SurvProp = logit(P) = log(P/(1-P)) = 4.5258 - 0.9360*Dose
- SurvProp: Proportion of surviving plants
- P: Probability of survival
- Dose: Dose of Glyphosate in g per hectare

- Fig 1: logistic regression curve fitted for the resistant plants
Results:
- Glyphosate concentration negatively affects survival (coefficient for Dose: -0.9360).
- The p-value for the coefficient is not statistically significant (0.205).
- The rate of change in the probability of survival with each unit increase in glyphosate dose is 0.9360 (approximately 61%).
Odds of Survival at 1 g glyphosate per hectare:
- The odds of survival are approximately 36.16.
LD50 Estimate:
- Estimated LD50 for resistant plants: 4.84 g/ha (95% confidence interval: 2.97 to 6.70 g/ha).
Analysis of Susceptible Population
Statistical Model: For the susceptible plants, the logistic regression model is given by: ln(p/(1-p)) = 1.992 - 10.16 * Dose
Results:
- Estimated LD50 for susceptible plants: 0.196 g/ha.
- Wide confidence interval (95% CI: 0 - 2.177 g/ha), indicating substantial uncertainty due to a small sample size and no deaths at lower doses.
Summary and Implications
The experiment explored the impact of glyphosate on resistant and susceptible populations of Amaranthus tuberculatus, revealing significant differences in their responses to the herbicide. Key findings and implications include:
- Divergent Responses: Resistant plants exhibited a higher LD50 value (4.84 g/ha) compared to susceptible plants (0.196 g/ha), indicating that resistant plants are less affected by glyphosate.
- Monitoring Herbicide Resistance: The study underscores the importance of monitoring weed populations for the development of herbicide resistance, which can have profound implications for weed management and crop production.
- Exposure Levels: The results hint at herbicide resistance evolving more rapidly in populations exposed to higher herbicide doses. This is evident in the resistant population found in a field with a history of glyphosate use.
- Sustainable Agriculture: These findings have implications for the development of effective weed management strategies, particularly within the context of sustainable agriculture.
This analysis demonstrates how statistical methods can be employed to assess the effects of glyphosate on different weed populations, shedding light on the dynamics of herbicide resistance and its potential impact on agriculture.
Related Samples
Dive into a rich pool of sample statistics assignments! Our collection covers diverse topics like probability distributions and data analysis. Whether you're a student seeking guidance or an enthusiast refreshing your knowledge, our samples offer valuable insights. Explore and elevate your understanding of statistics with ease!
Data Analysis
Data Analysis
Data Analysis
Data Analysis
Statistics
Data Analysis
tableau
Data Analysis
Data Analysis
Data Analysis
Data Analysis
Data Analysis
Data Analysis
R Programming
Data Analysis
Data Analysis
Data Analysis
Data Analysis
Data Analysis
Data Analysis
