Factorial Design Analysis and Interpretation Using SPSS: A Sample Assignment Solution

- Question:
- Instructions
- Scenario 1
- ANSWER
- ANSWER
- ANSWER
- ANSWER
- Scenario 2
- ANSWER
- ANSWER
- ANSWER
- ANSWER
- Scenario 3
- ANSWER
- ANSWER
- ANSWER
- ANSWER
Welcome to our comprehensive sample solution for the SPSS assignment, designed to provide expert SPSS assignment help. In this project, we analyze memory performance by examining the effects of different study formats (word, picture, and auditory) and test types (in-person vs. online). Using SPSS, we conduct detailed statistical analyses, create relevant graphs, and present the findings in APA format. This example illustrates how to approach complex statistical problems methodically, offering valuable insights into effective data analysis and interpretation with SPSS. For further assistance, our service is here to provide exceptional help with statistics assignments, ensuring you achieve your academic goals.
Question:
Instructions
Please note that for all problems in this course, the standard cut-off (alpha) for a test of significance will be .05, and you always report the exact power unless SPSS output states p=.000 (you’d report p<.001). Also, remember that we divide the p-value in half when reporting one-tailed tests with 1 – 2 groups. Also – remember to check your graphs! You often have to ADD the y – axis title.
** remember BS factors are entered into SPSS by having two columns regardless of number of levels. One column is used to identify the levels (e.g., 0 = male; 1 = female), and a second column for the DV values. In contrast, when entering a WS factor, you will have the same number of columns as you do levels, so if you have four levels (e.g., freshman, sophomore, junior, senior), you’d have four columns with the DV values in each per level.
Scenario 1
Does memory performance differ based on study format (word, picture, and auditory study styles) and/or test format (in person vs. online)? Students in a class (N = 36) were randomly assigned to one of three study conditions (studying lists of words, pictures, or by listening to the list), and randomly assigned to one of two test types (in person or online). This means there were different people in each of the six conditions (n = 6 per condition): word study / in-person test; word study / online test; picture study / in-person test; picture study / online test; auditory study / in-person test; auditory study / online test. Data shown below are percent correct for each of these conditions. Enter it into SPSS to conduct the appropriate analysis and answer the following questions.
| STUDY CONDITION | |||||||||||
|---|---|---|---|---|---|---|---|---|---|---|---|
| Word STUDY | Picture STUDY | Auditory STUDY | |||||||||
| TEST TYPE | In-person TEST | 88 | 79 | 68 | 80 | 90 | 92 | ||||
| 90 | 85 | 50 | 85 | 74 | 74 | ||||||
| 67 | 78 | 54 | 78 | 89 | 79 | ||||||
| Online TEST | 56 | 70 | 92 | 78 | 45 | 71 | |||||
| 62 | 65 | 88 | 95 | 51 | 89 | ||||||
| 59 | 67 | 87 | 90 | 67 | 93 | ||||||
1. How many factors are in this scenario? For each clearly labeled factor, state how many levels it has and list them. Also label each factor as “BS” or “WS”.
ANSWER
There are 2 factors in this scenario – Type of test, and Study Condition.
- Type of test – This is a BS factor with two levels
- Study Condition – This is a WS
2. Paste all relevant statistical output in the space provided below:
ANSWER
Descriptive Statistics
Dependent Variable: Correct %
| Test Type -Online | StudyCondition | Mean | Std. Deviation | N |
|---|---|---|---|---|
| In-PersonTest | Word | 81.1667 | 8.42417 | 6 |
| Picture | 69.1667 | 14.45568 | 6 | |
| Auditory | 83.0000 | 8.29458 | 6 | |
| Total | 77.7778 | 11.93391 | 18 | |
| Online Test | Word | 63.1667 | 5.19294 | 6 |
| Picture | 88.3333 | 5.81951 | 6 | |
| Auditory | 69.3333 | 19.40790 | 6 | |
| Total | 73.6111 | 15.81562 | 18 | |
| Total | Word | 72.1667 | 11.52731 | 12 |
| Picture | 78.7500 | 14.51097 | 12 | |
| Auditory | 76.1667 | 15.91930 | 12 | |
| Total | 75.6944 | 13.96898 | 36 |
Breusch-Pagan Test for Heteroskedasticitya,b,c
| Chi-Square | df | Sig. |
|---|---|---|
| 2.793 | 1 | 0.095 |
- Dependent variable: Correct %
- Tests the null hypothesis that the variance of the errors does not depend on the values of the independent variables.
- Predicted values from design: Intercept + Online + Study_condition_numeric + Online * Study_condition_numeric
Tests of Between-Subjects Effects
Dependent Variable: Correct %
| Source | Type III Sum of Squares | df | Mean Square | F | Sig. | Partial Eta Squared |
|---|---|---|---|---|---|---|
| CorrectedModel | 2898.472a | 5 | 579.694 | 4.424 | 0.004 | 0.424 |
| Intercept | 206267.361 | 1 | 206267.361 | 1,574.093 | 0.000 | 0.981 |
| Online | 156.250 | 1 | 156.250 | 1.192 | 0.284 | 0.038 |
| Study_condition_numeric | 264.056 | 2 | 132.028 | 1.008 | 0.377 | 0.063 |
| Online *Study_condition_numeric | 2478.167 | 2 | 1239.083 | 9.456 | 0.001 | 0.387 |
| Error | 3931.167 | 30 | 131.039 | |||
| Total | 213097.000 | 36 | ||||
| CorrectedTotal | 6829.639 | 35 |
- R Squared = 0.424 (Adjusted R Squared = 0.328)
3. Create appropriate graph(s) in SPSS and paste it in the space provided below (note select only the most relevant but you must have at least one – points will be deducted for additional graphs that are not the best choice based on the results of the analysis). (4 pts)
ANSWER
4. Present the results using APA format. This includes a full write-up to include a complete statistical notation as shown in the weekly presentations. The write-up also needs interpretation. If significant, state how. If it is not significant, what does that mean in layman’s terms? Additional examples of APA results sections are also available in the “Helpful Hints” document. (5 pts)
ANSWER
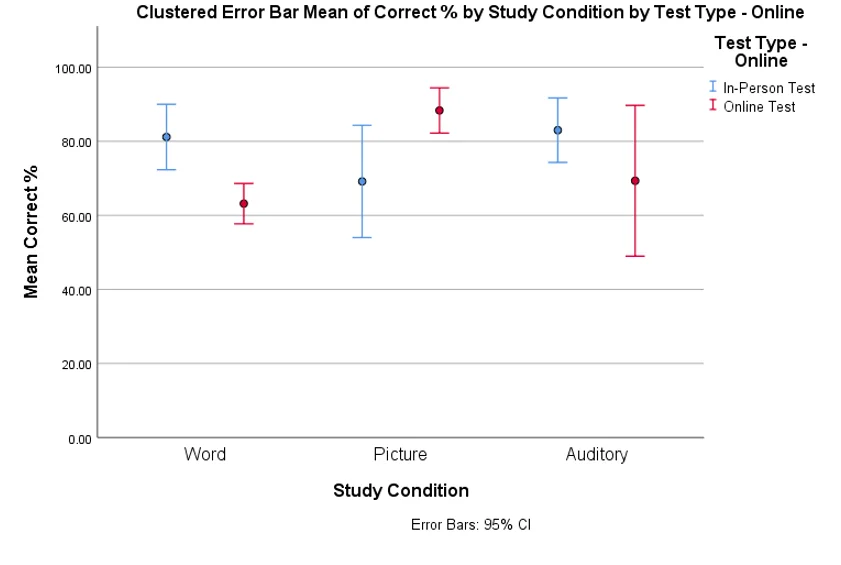
A two-way ANOVA with interaction was computed to test whether there was any difference in performance for In-person and Online test type as well as the study condition among word study, picture study, and auditory study. 6 students in In-person test under word study condition had average correct percentage of 81.17 (SD = 8.42); 6 students in In-person test under picture study condition had average correct percentage of 69.17 (SD = 14.56); 6 students in In-person test under auditory study condition had average correct percentage of 83.00 (SD = 8.29); 6 students in Online test under word study condition had average correct percentage of 63.17 (SD = 5.19); 6 students in Online test under picture study condition had average correct percentage of 88.33 (SD = 5.82); 6 students in Online test under auditory study condition had average correct percentage of 73.61 (SD = 19.41).
Two-way ANOVA with interaction showed that the main effects of study condition was insignificant, F(2,30)=1.008, p =.0377. The main effect of the type of test was also insignificant, F(1,30)=1.192, p =.284. However, the interaction between the type of test, and study condition was found to be statistically significant, F(2,30) = 9.46, p = .001. The Breusch-Pagan test for heteroskedasticity was statistically insignificant, χ2 = 2.793, p =.095.
Based on the ANOVA test and the plot, it was concluded that there is no clear winner in study condition for both types of tests, however, in case of online test, picture method was significantly better than the word method with auditory method indifferent from the two. In case of in-person test, none of the methods had significant advantage.
Scenario 2
A researcher wanted to investigate whether perception of intelligence is influenced by a person’s facial expression and/ or gender. Some photos were of males; others were of females, and within each of those groups, some were smiling whereas others had neutral facial expressions. All 12 participants were shown the same photo set. This means each participant judged every condition – male smiling; male neutral; female smiling; female neutral. Data are the average perceived intelligence scores for each condition per participant:
| Smiling pictures | Neutral pictures | |||
|---|---|---|---|---|
| Male photos | Female photos | Male photos | Female photos | |
| Participant A | 8.7 | 8.2 | 8.5 | 9.0 |
| Participant B | 9.1 | 8.0 | 9.0 | 8.5 |
| Participant C | 8.3 | 9.0 | 8.3 | 8.4 |
| Participant D | 9.5 | 8.8 | 9.4 | 9.2 |
| Participant E | 9.0 | 8.2 | 8.9 | 8.8 |
| Participant F | 7.7 | 7.0 | 7.8 | 7.5 |
| Participant G | 8.6 | 8.8 | 8.5 | 8.0 |
| Participant H | 8.5 | 7.3 | 8.4 | 7.7 |
| Participant I | 9.1 | 6.5 | 9.2 | 6.5 |
| Participant J | 9.2 | 8.0 | 9.1 | 8.1 |
| Participant K | 8.2 | 8.1 | 8.1 | 8.3 |
| Participant L | 8.0 | 7.5 | 7.9 | 7.9 |
5. How many factors are in this scenario? For each clearly labeled factor, state how many levels it has and list them. Also label each factor as “BS” or “WS”.
ANSWER
There are two factors in the scenario – Gender, a BS factor with 2 levels; and expression, a BS factor with 2 levels.
6. Paste all relevant statistical output in the space provided below:
ANSWER
Descriptive Statistics
Dependent Variable: Average Perceived Intelligence
| Expression | Gender | Mean | Std. Deviation | N |
|---|---|---|---|---|
| Smile | Male | 8.6583 | 0.54181 | 12 |
| Female | 7.9500 | 0.75859 | 12 | |
| Total | 8.3042 | 0.73926 | 24 | |
| Neutral | Male | 8.5917 | 0.52477 | 12 |
| Female | 8.1583 | 0.73170 | 12 | |
| Total | 8.3750 | 0.66086 | 24 | |
| Total | Male | 8.6250 | 0.52274 | 24 |
| Female | 8.0542 | 0.73661 | 24 | |
| Total | 8.3396 | 0.69458 | 48 |
Breusch-Pagan Test for Heteroskedasticitya,b,c
| Chi-Square | df | Sig. |
|---|---|---|
| 2.435 | 1 | 0.119 |
- Dependent variable: Average Perceived Intelligence
- Tests the null hypothesis that the variance of the errors does not depend on the values of the independent variables.
- Predicted values from design: Intercept + Expression_Num + Gender_Num + Expression_Num * Gender_Num
Tests of Between-Subjects Effects
Dependent Variable: Average Perceived Intelligence
| Source | Type III Sum of Squares | df | Mean Square | F | Sig. |
|---|---|---|---|---|---|
| CorrectedModel | 4.197a | 3 | 1.399 | 3.332 | 0.028 |
| Intercept | 3338.335 | 1 | 3338.335 | 7,949.493 | 0.000 |
| Expression_Num | 0.060 | 1 | 0.060 | 0.143 | 0.707 |
| Gender_Num | 3.910 | 1 | 3.910 | 9.311 | 0.004 |
| Expression_Num* Gender_Num | 0.227 | 1 | 0.227 | 0.540 | 0.466 |
| Error | 18.478 | 44 | 0.420 | ||
| Total | 3361.010 | 48 | |||
| CorrectedTotal | 22.675 | 47 |
- R Squared = 0.185 (Adjusted R Squared = 0.130)
7. Create appropriate graph(s) in SPSS and paste it in the space provided below (note select only the most relevant but you must have at least one – points will be deducted for additional graphs that are not the best choice based on the results of the analysis). (4 pts) HINT ON THIS PARTICULAR SCENARIO: If you need to create a graph for a significant ME, you will have to average the two columns for each particular level (e.g., if the ME Gender is significant, you’d want to compute a new variable that averages the scores for smiling_male and neutral_male, and another new variable for smiling_female and neutral_female, then you would create the appropriate graph for those two columns). It is highly recommended you have SPSS calculate these for you to reduce error (see this week’s presentation in for SPSS – example 2 shows how to create an “averaged” variable).
ANSWER
8. Present the results using APA format. This includes a full write-up to include a complete statistical notation as shown in the weekly presentations. The write-up also needs interpretation. If significant, state how. If it is not significant, what does that mean in layman’s terms? Additional examples of APA results sections are also available in the “Helpful Hints” document.
ANSWER
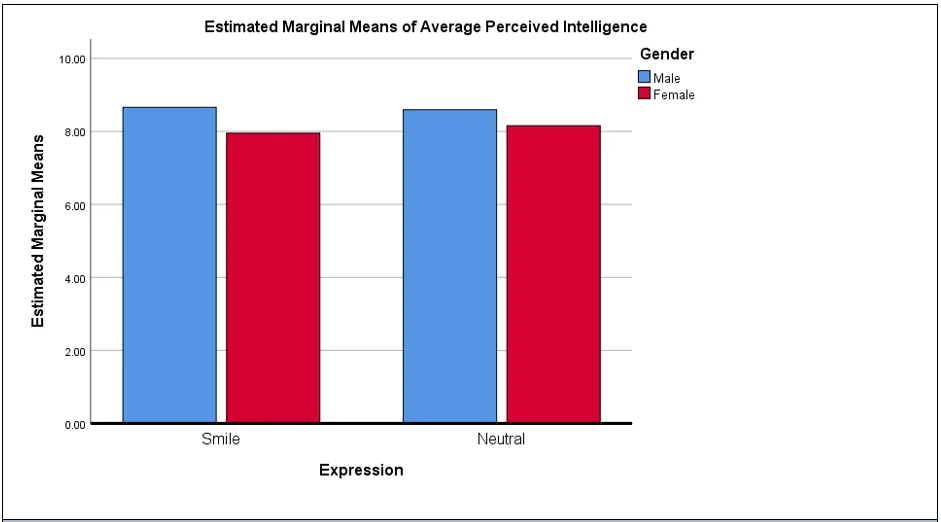
A two-way ANOVA with interaction was computed to test if there is any difference in average perceived intelligence in case of males, and females, when the person is smiling vs when the person is neutral. The 12 participants rated the average perceived intelligence of smiling males at 8.66 (SD=0.54), rated the average perceived intelligence of smiling females at 7.95 (SD = 0.76), rated average perceived intelligence of neutral males at 8.59 (SD = 0.52), rated average perceived intelligence of neutral females at 8.16 (SD=0.73).
Based on the two-way ANOVA, the main effect of expression was statistically insignificant, F(1,44) = 0.14, p=.707. The main effect of gender was statistically significant, F(1,44) = 9.31, p = .004. The interaction effect was found to be statistically insignificant, F(1,44) = 0.54, p = .466. The Breusch-Pagan test for heteroskedasticity was statistically insignificant, χ2 = 2.43, p =.119.
Based on the ANOVA test result, it was concluded that the average perceived intelligence is not affected by facial expression, but gender has an effect. Males were rated higher average perceived intelligence as compared to female regardless of the facial expressions.
Scenario 3
Participants (N=12) in a study were randomly assigned to one of two types of therapy – either talk therapy or drug therapy (n = 6 per condition). Mood scores were analyzed at two time points for all clients: 4 weeks and 12 weeks into the start of the therapy. Mood scores are presented in the table below, with higher scores indicating improved / more positive moods. Use the data to answer the questions in this set.
| Talk | Drug | ||||
|---|---|---|---|---|---|
| 4 weeks | 12 weeks | 4 weeks | 12 weeks | ||
| P1 | 7 | 9 | P7 | 4 | 7 |
| P2 | 5 | 7 | P8 | 5 | 9 |
| P3 | 4 | 5 | P9 | 4 | 5 |
| P4 | 6 | 6 | P10 | 3 | 6 |
| P5 | 7 | 8 | P11 | 2 | 5 |
| P6 | 7 | 7 | P12 | 4 | 6 |
9. How many factors are in this scenario? For each clearly labeled factor, state how many levels it has and list them. Also label each factor as “BS” or “WS”.
ANSWER
There are two factors in this scenario – type of therapy, a BS factor with 2 levels; and time point, a BS factor with 2 levels.
10. Paste all relevant statistical output in the space provided below:
ANSWER
Descriptive Statistics
Dependent Variable: Mood Score
| Type ofTherapy | Time point | Mean | Std. Deviation | N |
|---|---|---|---|---|
| Talk | 4 Weeks | 6.0000 | 1.26491 | 6 |
| 12 Weeks | 7.0000 | 1.41421 | 6 | |
| Total | 6.5000 | 1.38170 | 12 | |
| Drug | 4 Weeks | 3.6667 | 1.03280 | 6 |
| 12 Weeks | 6.3333 | 1.50555 | 6 | |
| Total | 5.0000 | 1.85864 | 12 | |
| Total | 4 Weeks | 4.8333 | 1.64225 | 12 |
| 12 Weeks | 6.6667 | 1.43548 | 12 | |
| Total | 5.7500 | 1.77544 | 24 |
Breusch-Pagan Test for Heteroskedasticitya,b,c
| Chi-Square | df | Sig. |
|---|---|---|
| 0.633 | 1 | 0.426 |
- Dependent variable: Mood Score
- Tests the null hypothesis that the variance of the errors does not depend on the values of the independent variables.
- Predicted values from design: Intercept + Therapy + Time + Therapy * Time
Tests of Between-Subjects Effects
Dependent Variable: Mood Score
| Source | Type III Sum of Squares | df | Mean Square | F | Sig. |
|---|---|---|---|---|---|
| CorrectedModel | 37.833a | 3 | 12.611 | 7.276 | 0.002 |
| Intercept | 793.500 | 1 | 793.500 | 457.788 | 0.000 |
| Therapy | 13.500 | 1 | 13.500 | 7.788 | 0.011 |
| Time | 20.167 | 1 | 20.167 | 11.635 | 0.003 |
| Therapy *Time | 4.167 | 1 | 4.167 | 2.404 | 0.137 |
| Error | 34.667 | 20 | 1.733 | ||
| Total | 866.000 | 24 | |||
| CorrectedTotal | 72.500 | 23 |
a. R Squared = 0.522 (Adjusted R Squared = 0.450)
11. Create appropriate graph(s) in SPSS and paste it in the space provided below (note select only the most relevant but you must have at least one – points will be deducted for additional graphs that are not the best choice based on the results of the analysis). (4 pts)
ANSWER
12. Present the results using APA format. This includes a full write-up to include a complete statistical notation as shown in the weekly presentations. The write-up also needs interpretation. If significant, state how. If it is not significant, what does that mean in layman’s terms? Additional examples of APA results sections are also available in the “Helpful Hints” document.
ANSWER
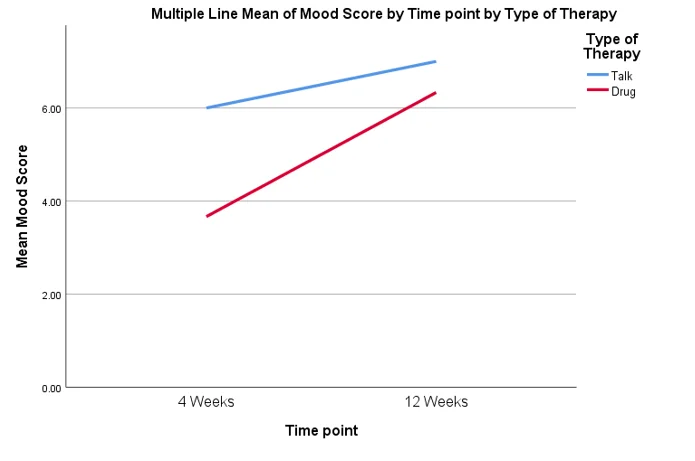
A two-way ANOVA with interaction was computed to test if there is any difference in average mood score for the two types of therapy at different time points. 6 participants in talk therapy reported average mood score of 6.00 (SD=1.26) at 4-week time, and 7.00 (SD=1.41) at 12-week time. 6 participants in drug therapy reported average mood score of 3.67 (SD=1.03) at 4-week time, and 6.33 (SD=1.51) at 12-week time.
Based on the two-way ANOVA, the main effect of therapy was statistically significant, F(1,20) = 7.79, p=.011. The main effect of time was statistically significant, F(1,20) = 11.64, p = .003. The interaction effect was found to be statistically insignificant, F(1,20) = 2.40, p = .137. The Breusch-Pagan test for heteroskedasticity was statistically insignificant, χ2 = 0.633, p =.426.
Based on the ANOVA test result, it was concluded that the average mood score improved at 12-week time from 4-week time for both types of therapy. However, the talk therapy had higher mood score than the drug therapy at both time intervals. There was no evidence of interaction in the data.
You Might Also Like
We offer expert assistance for your statistics assignments and a variety of sample questions. Our samples are crafted to provide clear insights into complex statistical concepts, helping you enhance your understanding and excel in your assignments. Explore our resources for getting your assignment done.
Statistics
STATA
Statistics
SPSS
Data Analysis
Statistics
SPSS
SPSS
SPSS
SPSS
SPSS
SPSS
SPSS
SPSS
SPSS
SPSS
SPSS
SPSS