- Problem Description:
- Description of the General Pattern of Correlation:
- Correlation Coefficient (r):
- Explaining the Logic:
- Possible Directions of Causality:
- Correlational vs. Cause-and-Effect Studies:
This inquiry goes beyond merely identifying a correlation; it seeks to illuminate the underlying patterns and potential causal links that govern the behaviour of the variables in question. The significance of this endeavour lies in its capacity to provide a nuanced understanding of how changes in one variable might influence the other, contributing to the broader landscape of scientific inquiry. Through the creation of a scatter diagram and the application of correlation coefficients, this exploration ventures into both visual and quantitative realms to decipher the nature of the observed relationship. Ultimately, the hypothesis invites a comprehensive investigation into the causative factors that drive the correlation, recognizing that correlation, while indicative, does not inherently establish the directional influences between variables.
Problem Description:
The correlation analysis assignmentaims to investigate the relationship and potential causality between two variables through the use of a scatter diagram and correlation coefficient analysis.

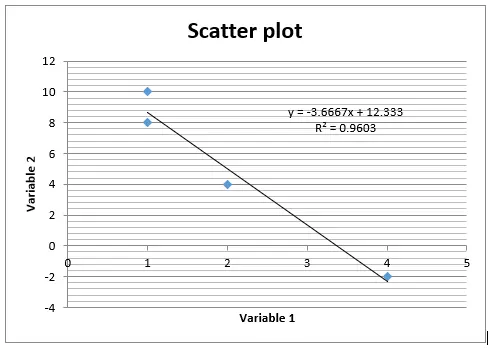
Figure 1: Creating a Scatter Diagram
Description of the General Pattern of Correlation:
The scatter diagram reveals a robust negative linear relationship between Variable 1 and Variable 2. As Variable 1 increases, Variable 2 consistently decreases, forming a tight cluster along a descending straight line.
Correlation Coefficient (r):
The correlation coefficient (r) quantifies this linear relationship, with a calculated value of -0.98. This exceptionally close-to -1 value signifies an extremely strong negative correlation, indicating that as Variable 1 increases, Variable 2 decreases almost perfectly in a linear fashion.
Explaining the Logic:
Correlation, a statistical measure, helps unveil patterns between two variables. In this scenario, Variable 1 and Variable 2 undergo scrutiny. The scatter plot and correlation coefficient reveal the strength and direction of this pattern. With a correlation coefficient of -0.98, the data suggests that changes in Variable 1 are highly predictive of changes in Variable 2. However, correlation alone cannot establish causation.
Possible Directions of Causality:
Determining causality solely from correlation is challenging, but three logically plausible directions are considered:
- Variable 1 causes changes in Variable 2: Implies that alterations in Variable 1 directly influence Variable 2. Improving Variable 1 might lead to a corresponding decrease in Variable 2.
- Variable 2 causes changes in Variable 1: Suggests that changes in Variable 2 drive changes in Variable 1. This direction, while possible, may be less intuitive based on the nature of the variables.
- Third Variable: A third unconsidered variable might be influencing both Variable 1 and Variable 2, creating a false appearance of a direct relationship.
Correlational vs. Cause-and-Effect Studies:
Correlational studies explore relationships without manipulating variables, utilizing correlation coefficients for quantification. However, they do not imply causation. Cause-and-effect studies, often experimental, manipulate variables to demonstrate direct causality. The key distinction lies in the ability to infer causation: correlational studies identify relationships, while cause-and-effect studies seek to prove causality through manipulation and control of variables.
Related Samples
Explore our vast collection of samples designed to aid in understanding statistical concepts effectively. Covering a diverse range of topics, our samples provide valuable insights and practical examples for learners at every level. Dive into our carefully curated selection to deepen your comprehension and excel in your statistical assignments.
Statistical Analysis
Statistical Analysis
Statistical Analysis
Statistical Analysis
Statistical Analysis
Statistical Analysis
Statistical Analysis
Statistical Analysis
STATA
Statistical Analysis
Statistics
Statistical Analysis
Statistical Analysis
SAS
R Programming
Statistical Analysis
Statistical Analysis
Statistics
Statistical Analysis
SPSS
