- Problem Description:
- Introduction
- ACR (Lot Size):
- RNTP (Monthly Rent):
- HHL (Household Language):
- HHT (Household/Family Type):
- Visualization and Data Story
- Graph (1) [by Tableau]:
- Graph (2) [by Excel]:
- Reflection:
- Tableau vs. MS Excel:
Examining relationships between lot sizes and monthly rent, understanding household language distribution, and decoding family types, the narrative unfolds through rich visualizations. Amidst reflections on addressing challenges like null values, the exploration provides valuable insights for comprehending the dynamics of Oregon's housing landscape and informs strategic planning for the future.
Problem Description:
The assignment on Tableau involves analyzing a public use microdata sample (PUMS) from the US Census Bureau's American Community Survey (ACS) for housing units in Oregon's Pacific West region. The dataset, containing 14,475 records, is designed to maintain individual and housing unit confidentiality. The objective is to explore the relationships between various housing unit features and characteristics, with a focus on lot size, monthly rent, household language, and family type.
Introduction
Q1.What is this dataset about? This dataset, a PUMS for housing units in Oregon, comprises 239 columns representing the features of each unit. The data is sourced from the ACS, ensuring confidentiality. Key details include family type, internet access, kitchen facilities, and numeric variables like monthly rent and yearly income.
Q2. Describe the variables you use and what they mean in context.
ACR (Lot Size):
- N/A (GQ/not a one-family house or mobile home).
- House on less than one acre.
- House on one to less than ten acres.
- House on ten or more acres.
RNTP (Monthly Rent):
- Numeric (5 digits): $1 to $99,999.
HHL (Household Language):
- N/A (GQ/vacant).
- English only.
- Spanish.
- Other Indo-European languages.
- Asian and Pacific Island languages.
- Other language.
HHT (Household/Family Type):
- N/A (GQ/vacant).
- Married couple household.
- Another family household: Male householder, no spouse present.
- Other family household: Female householder, no spouse present.
- Nonfamily household: Male householder: Living alone.
- Nonfamily household: Male householder: Not living alone.
- Nonfamily household: Female householder: Living alone.
- Nonfamily household: Female householder: Not living alone.
Q3.Why did you choose these variables?
- Lot Size (ACR): Investigating its relationship with monthly rent provides insights into how unit sizes affect rent.
- Household Language (HHL): Illustrates the distribution of ethnicity across Oregon households.
- Family Type (HHT): Identifying the prevalent family types helps in future planning.
Visualization and Data Story

Graph (1) [by tableau]

Graph (2) [by Excel]
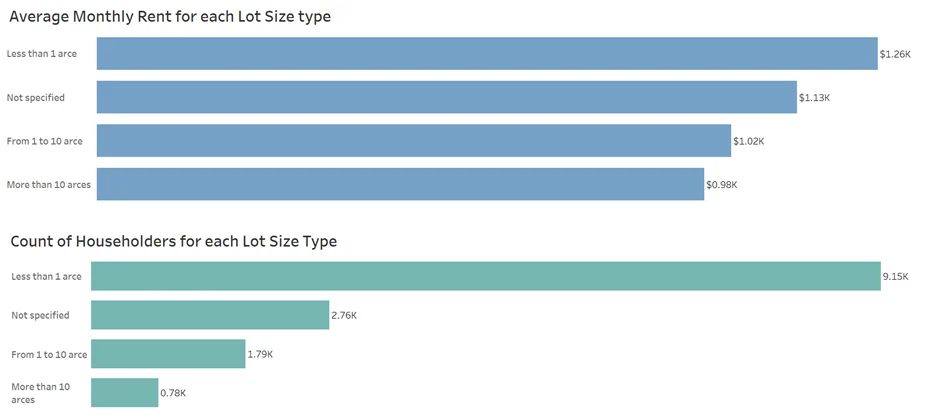
Graph (1) [by Tableau]:
- Strongly demonstrates the relationship between average monthly rent and unit size in acres.
- No apparent correlation found.
- Units less than 1 acre show higher average monthly rent, prompting consideration of other factors.
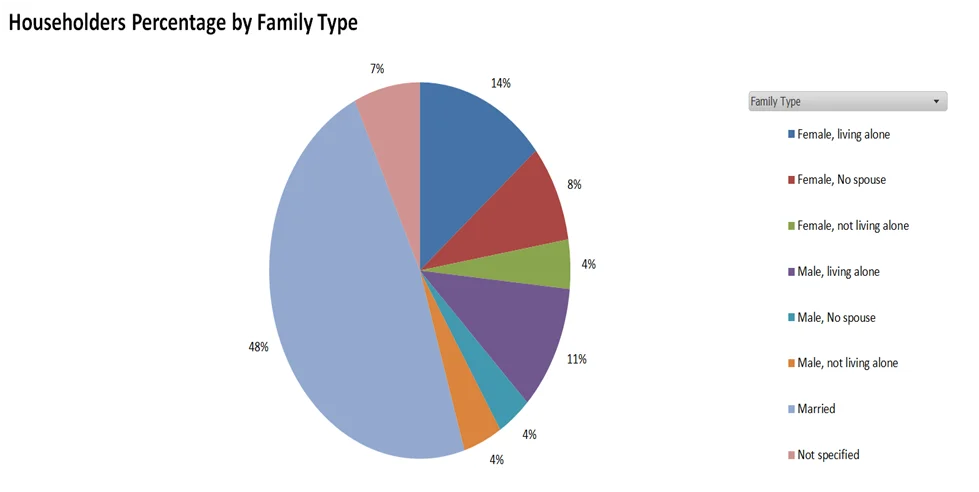
Graph (2) [by Excel]:
- Complements Graph (1) with a different perspective.
- Useful for purposes beyond the direct correlation between unit size and monthly rent.
Reflection:
Dealt with null values in the monthly rent column by filling them with the column's average.
Tableau vs. MS Excel:
- Tableau handles a larger dataset with more advanced plots.
- Excel, with simpler plots, is suitable for data analysis and storage.
- Considerations include troubleshooting ease and the need for data aggregation.
This analysis provides a comprehensive view of housing characteristics in Oregon, revealing potential influences on monthly rent beyond lot size. It emphasizes the importance of exploring diverse features to enhance understanding and guide future planning.
Related Samples
Explore our diverse collection of sample materials, meticulously crafted to aid in your comprehension of statistical concepts. Covering a multitude of topics, our samples provide invaluable insights and practical examples suitable for learners at every level. Immerse yourself in our carefully selected samples to deepen your understanding and excel in your statistical assignments.
Data Analysis
Data Analysis
Data Analysis
Data Analysis
Statistics
Data Analysis
tableau
Data Analysis
Data Analysis
Data Analysis
Data Analysis
Data Analysis
Data Analysis
R Programming
Data Analysis
Data Analysis
Data Analysis
Data Analysis
Data Analysis
Data Analysis
