Exploring Health and Behavioral Patterns: A Comprehensive Statistical Analysis

- Question 1:
- Question 2:
- Question 3:
- Question 4:
- Question 5:
- Question 6:
- Question 7:
- Question 8:
- Question 9:
- Question 10:
In this comprehensive statistical analysis, we delve into various aspects of health and behavior through a series of rigorous tests and examinations. From investigating gender differences in fitness training time to exploring the impact of therapy on systolic blood pressure, each question is designed to unveil insights into the intricate relationships within our dataset. The statistical journey takes us through one-way ANOVA, paired samples t-tests, Pearson's chi-squared tests, Mann-Whitney U tests, and more. Each result contributes to a nuanced understanding of the dataset, providing valuable information for further research and decision-making in the realms of health and well-being.
Question 1:
Choose suitable variable/s to run the Independent Samples t-test. Provide output and a report on your data analysis.
Independent Samples T-test on Fitness Training Time- Problem Description: Investigate if there is a significant difference in mean fitness training time between males and females in a group.
- Hypothesis: H0: μmale=female vs. HA: μmalefemale
- Findings: The p-value is 0.051, indicating a non-significant difference. Do not reject the null hypothesis.
Question 2:
Choose suitable variable/s to run One-Way ANOVA. Provide output and a report on how to write your statistical analysis assignment including findings of post-hoc analysis if required.
One-Way ANOVA on Depressive Symptoms Score- Problem Description: Explore if there are mean differences in depressive symptom scores across different blood groups.
Hypothesis: at least one population mean is different from another
H0: µ1 (A positive) = μ2 (B positive) = μ3 (AB positive) = μ4 (O positive)
HA: Not all of µ1, μ2, μ3 and μ4 are equal
- Findings: The p-value is 0.000, rejecting the null hypothesis. Post-hoc analysis reveals specific group differences.
Question 3:
Choose suitable variable/s to run the Paired Samples t-test. Provide output and a report on your data analysis.
Paired Samples t-test on Systolic Blood Pressure- Problem Description: Assess if there is a significant change in systolic blood pressure before and after therapy.
- H0: µ1 (Systolic Blood Pressure Before Therapy) = μ2 (Systolic Blood Pressure After Therapy)
- Findings: A significant difference (p = 0.000) supports the effectiveness of therapy in reducing systolic blood pressure.
HA: µ1 (Systolic Blood Pressure Before Therapy) < μ2 (Systolic Blood Pressure After Therapy)
Question 4:
Choose suitable variable/s to run Pearson’s Chi-squared test. Provide output and a report on your data analysis.
Pearson’s Chi-squared Test on Therapy and Employment Status- Problem Description:Examine the association between therapy type and employment status.
- H0: There is no association between Therapy and Employment Status
- Findings: Significant association (p = 0.000) between therapy type and employment status.
HA: There exists an association between Therapy and Employment Status
Question 5:
Choose suitable variable/s to run the Mann-Whitney U test. Provide output and a report on your data analysis.
Mann-Whitney U test on Self-Rated Health and Gender- Problem Description: Investigate if there are differences in self-rated health between genders.
- H0: The distribution of Self Rated Health is the same across categories of Gender.
- Findings: Significant differences (p = 0.001) in the distribution of self-rated health between genders.
HA: The distribution of Self Rated Health is not the same across categories of Gender.
Question 6:
Choose suitable variable/s to run the Wilcoxon Signed Rank test. Provide output and a report on your data analysis.
Wilcoxon Signed Rank test on SPSS Agreement Differences
- Problem Description: Examine if there's a significant median difference in SPSS agreement before and after.
- H0: The median of differences between SPSS Agreement Semester Commencing and SPSS Agreement Semester Ending equals 0.
- Findings: Significant difference (p = 0.000), rejecting the null hypothesis.
HA: The median of differences between SPSS Agreement Semester Commencing and SPSS Agreement Semester Ending is not equal to 0
Question 7:
Choose suitable variable/s to run Pearson’s Correlation analysis. Provide output and a report on your data analysis.
Pearson’s Correlation on Age and Depressive Symptoms Score
- Problem Description: Explore the correlation between age and depressive symptoms score.
- H0: There is no correlation between Age and Depressive Symptoms Score.
- Findings: A weak positive correlation (0.091) is found to be significant (p = 0.032).
HA: There is a correlation between Age and Depressive Symptoms Score.
Question 8:
Choose suitable variable/s to run Kruskal-Wallis ANOVA. Provide output and a report on your data analysis.
Kruskal-Wallis ANOVA on Course Weighted Average and Employment Status
- Problem Description:Assess if the distribution of Course Weighted Average differs among employment status categories.
- H0: The distribution of Course Weighted Average is the same across categories of Employment Status.
- Findings: Significant difference (p = 0.044) in the distribution across employment statuses.
HA: The distribution of Course Weighted Average is not the same across categories of Employment Status.
Question 9:
Choose suitable variable/s to run Spearman’s Rho analysis. Provide output and a report on your data analysis.
Spearman’s Rho on Fitness Training Time and Email Time
- Problem Description: Examine if there's a correlation between fitness training time and email time.
- H0: There is no correlation between Fitness training time and Email time.
- Findings: No significant correlation (p = 0.087) is observed.
HA: There is a correlation between Fitness training time and Email time.
Question 10:
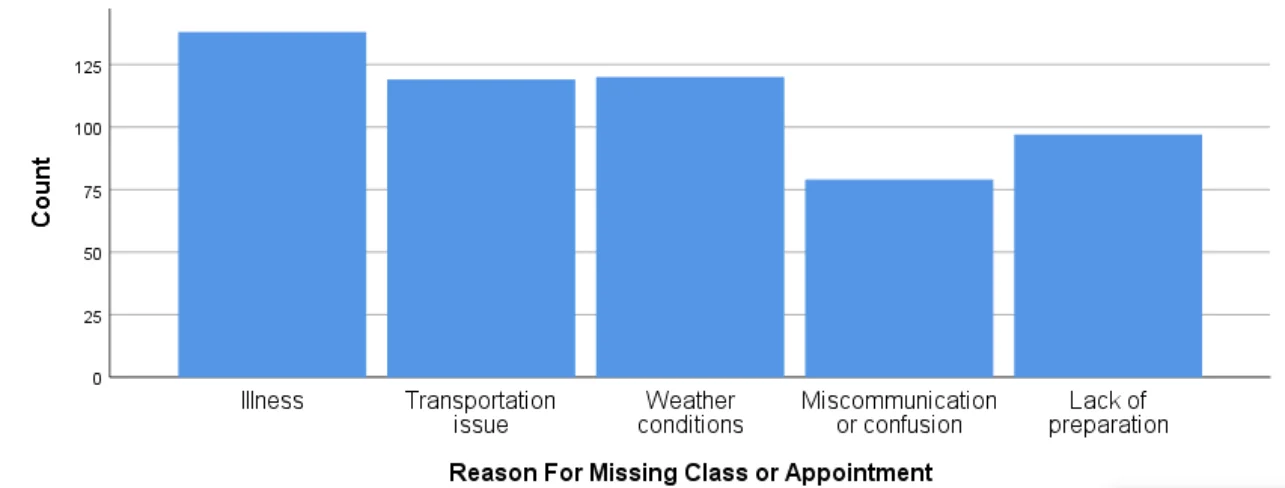
All participants were asked to provide a reason for missing their most recent class/appointment. The five most common reasons are coded as A, B, C, D & E (Variable: ReasonForMissingClass/Appointment).
Reason for Missing Class/Appointment - Bar Graph
- Problem Description: Explore the reasons (codes A, B, C, D, E) participants provided for missing their most recent class/appointment.
- Graph: Bar graph depicting the frequency of each reason code with appropriate labels.
Related Samples
Explore our diverse array of sample assignments, offering invaluable insights into statistics-related topics. Dive into practical examples designed to enhance your understanding and proficiency in statistics. From basic concepts to advanced techniques, these samples serve as a valuable resource for learners at every level. Start exploring and empower your statistical skills today!
SPSS
SPSS
SPSS
Statistical Tests
Statistical Analysis
SPSS
Statistical Analysis
Statistical Analysis
Statistical Analysis
SPSS
Statistical Analysis
Statistical Analysis
Statistical Analysis
Statistical Analysis
STATA
SPSS
Statistical Analysis
Statistics
SPSS
Statistical Analysis