Statistical Analysis Assignment: Exploring Academic Performance and Geographic Factors

- Problem Description
- Problem 1:
- Model Summary
- Coefficientsa
- Problem 2:
- Hypotheses:
- Paired Samples Test:
- Paired Samples Test Tables
- Problem 3:
- Descriptives
- Test of Homogeneity of Variances
- ANOVA
In this comprehensive statistical analysis assignment, we examine various facets of academic performance and their relationships. The first problem unveils a strong positive correlation between 10th and 12th-grade science achievements, providing insights into how early success can predict future outcomes. The second problem delves into the impact of different learning modalities (Zoom and in-person) on final exam scores, offering a glimpse into the evolving world of education. Lastly, we explore the influence of geographic location on 12th-grade math achievement, shedding light on regional disparities in academic performance. These analyses collectively provide valuable perspectives on educational and geographical factors affecting student success.
Problem Description
This assignment delves into three Statistical Analysis assignment. Firstly, it explores the strong positive correlation between 10th-grade and 12th-grade science achievement, utilizing a regression model. Secondly, it tests for a significant difference in final exam scores between in-person and Zoom class attendees. Finally, it investigates the influence of geographic location on 12th-grade math achievement using ANOVA. The results provide valuable insights into educational and geographical impacts on academic performance.
Problem 1:
Analysis of 10th and 12th Grade Science Achievement
In this problem, we conducted an analysis to determine the relationship between 10th-grade science achievement and 12th-grade science achievement. Here are the key findings:
Model Summary
| Model | R | R Square | Adjusted R Square | Std. Error of the Estimate |
|---|---|---|---|---|
| 1 | .786a | .618 | .617 | 5.30447 |
Table 1: Predictors: (Constant), Tenth Grade Science Achievement
Coefficientsa
| Model | Unstandardized Coefficients | Standardized Coefficients | t | Sig. | ||
|---|---|---|---|---|---|---|
| B | Std. Error | Beta | ||||
| 1 | (Constant) | 14.577 | 1.658 | 8.789 | .000 | |
| Tenth Grade Science Achievement | .739 | .029 | .786 | 25.233 | .000 | |
Table 2: Dependent Variable: Twelfth Grade Science Achievement
- Correlation: The correlation between the two variables is 0.786, indicating a strong positive correlation. This means that higher 10th-grade science achievement is associated with higher 12th-grade science achievement.
- Regression Equation: achsci12 = 14.577 + 0.739 * achsci10
- Coefficient of Determination: The coefficient of determination (R Square) is 0.618, indicating that 61.8% of the variability in the dependent variable (12th-grade science achievement) is explained by the model.
- Coefficient of Non-Determination:The coefficient of non-determination is 0.382, suggesting that 38.2% of the variation in the dependent variable is not explained by the model.
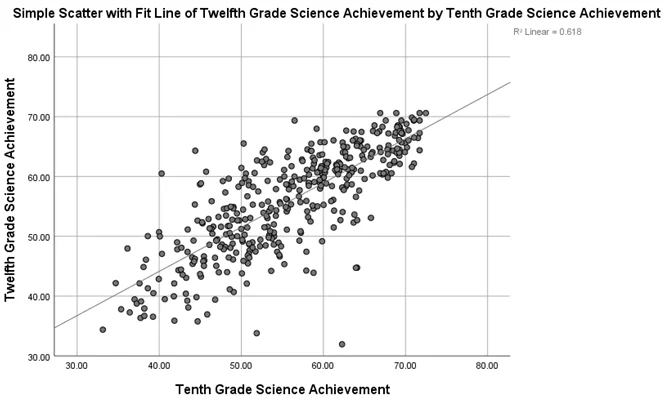
Fig 1:Scatterplot with fit line of 12th grade science achievement
Problem 2:
Comparison of Exam Scores for Zoom and In-Person Classes
This problem involves testing whether there is a significant difference in average scores on a final exam between students who attended classes on Zoom and students who attended classes in person.
Hypotheses:
- Null Hypothesis (H0):The average scores on the final exam are the same for both Zoom and in-person classes.
- Alternative Hypothesis (Ha): The average scores on the final exam differ between Zoom and in-person classes.
Paired Samples Test:
The t-test value is -2.689, and the correlation between Zoom and in-person class scores is 0.359.
| Paired Samples Test | |||||||||
|---|---|---|---|---|---|---|---|---|---|
| Paired Differences | t | df | Sig. (2-tailed) | ||||||
| Mean | Std. Deviation | Std. Error Mean | 95% Confidence Interval of the Difference | ||||||
| Lower | Upper | ||||||||
| Pair 1 | Attending in Zoom - Attending in Person | -4.20000 | 4.93964 | 1.56205 | -7.73360 | -.66640 | -2.689 | 9 | .025 |
| Paired Samples Correlations | ||||
|---|---|---|---|---|
| N | Correlation | Sig. | ||
| Pair 1 | Attending in Zoom & Attending in Person | 10 | .359 | .308 |
Paired Samples Test Tables
Result:
The t-test for correlated samples revealed that attending in person produced significantly different average scores in the final exam (M=84.00) compared to students attending on Zoom (M=79.80). The t-statistic is -2.689, and the p-value is less than 0.05, indicating a significant difference.
Problem 3:
Impact of Geographic Location on 12th Grade Math Achievement
In this problem, we examined the impact of geographic location on 12th-grade math achievement. Here are the key findings:
Descriptive Statistics: The mean, standard deviation, and other statistics for 12th-grade math achievement are provided for different geographic regions.
Descriptives
Twelfth Grade Math Achievement
| N | Mean | Std. Deviation | Std. Error | 95% Confidence Interval for Mean | Minimum | Maximum | ||
|---|---|---|---|---|---|---|---|---|
| Lower Bound | Upper Bound | |||||||
| Northeast | 80 | 58.9418 | 7.48700 | .83707 | 57.2756 | 60.6079 | 34.36 | 70.42 |
| North Central | 100 | 55.6329 | 8.12019 | .81202 | 54.0217 | 57.2441 | 34.88 | 70.18 |
| South | 144 | 56.2279 | 8.07886 | .67324 | 54.8971 | 57.5587 | 35.48 | 70.69 |
| West | 75 | 58.1313 | 7.99595 | .92329 | 56.2916 | 59.9710 | 36.57 | 71.05 |
| Total | 399 | 56.9807 | 8.03430 | .40222 | 56.1900 | 57.7714 | 34.36 | 71.05 |
Table 4: Descriptive statistics- Results of SPSS
Test of Homogeneity of Variances: The test indicates that there is homogeneity of variance among the groups.
Test of Homogeneity of Variances
| Levene Statistic | df1 | df2 | Sig. | ||
|---|---|---|---|---|---|
| Twelfth Grade Math Achievement | Based on Mean | .707 | 3 | 395 | .548 |
| Based on Median | .636 | 3 | 395 | .592 | |
| Based on Median and with adjusted df | .636 | 3 | 394.094 | .592 | |
| Based on trimmed mean | .752 | 3 | 395 | .522 | |
Table 5: Test of Homogeneity of Variances
ANOVA:An analysis of variance (ANOVA) was performed, showing that there is a significant impact of geographic location on 12th-grade math achievement.
ANOVA
Twelfth Grade Math Achievement
| Mean Square | F | Sig. |
|---|---|---|
| 223.404 | 3.527 | .015 |
| 63.344 |
Table 6: ANOVA Results
Conclusion:Students from different geographic regions have varying levels of math achievement, with the Northeast region having the highest mean score and the North Central region having the lowest. The one-way ANOVA test confirms that these differences are statistically significant.
Related Samples
Explore our extensive array of samples tailored to your statistical needs. From regression analysis to hypothesis testing, delve into practical examples elucidating complex concepts. Each sample offers clarity and guidance, empowering you to excel in your statistical endeavors. Elevate your understanding with our comprehensive selection of statistical assignments.
Statistics
Statistics
Statistics
Statistics
Statistics
Statistics
Statistics
Statistics
Statistics
Statistics
Statistics
Statistical Analysis
Statistics
Statistical Analysis
Statistical Analysis
Statistics
Statistical Analysis
Statistics
Statistics
Statistics