Exploring Individual Orientation at Del Group through Comprehensive Factor Analysis

- Problem Description:
- Methods:
- Total Variance Explained
- Results:
- Implications:
- Conclusion:
In our in-depth analysis, we delve into the world of Del Group's individual orientation measures, unveiling a rich tapestry of insights. Through rigorous exploratory factor analysis, we explore the suitability of the data, determine the optimal number of factors, and establish the reliability and validity of these measures. Our findings present a valuable roadmap for Del Group, offering a clear understanding of employee dynamics and how they impact organizational performance. This analysis equips Del Group with the tools to drive strategic decisions and enhance workforce productivity.
Problem Description:
This analysis centers on the investigation of individual orientation items within Del Group, with the primary aim of conducting an extensive exploratory factor analysis. The goal is to evaluate the data's appropriateness for factor analysis, ascertain the ideal number of factors for extraction, establish the reliability and validity of the measures, and explore the potential value of these factors in predicting productivity or performance among employees. If you need assistance with your factor analysis assignment, this report can provide valuable insights to support your understanding and completion of the task.
Methods:
The analysis entailed a systematic approach, employing exploratory factor analysis as the central method for examining the individual orientation measures. Key statistical tests were performed to ensure the soundness of the data and to guide factor extraction. The following methods were applied:
Data Suitability Assessment: The Kaiser-Meyer-Olkin Measure of Sampling Adequacy (KMO) was employed to evaluate data suitability. A KMO value of 0.874 was obtained, surpassing the commonly accepted threshold of 0.5. Furthermore, Bartlett's Test of Sphericity returned a highly significant chi-square value of 3784.381 (p < 0.001), affirming the appropriateness of the dataset for factor analysis.
| KMO and Bartlett's Test | ||
|---|---|---|
| Kaiser-Meyer-Olkin Measure of Sampling Adequacy. | .874 | |
| Bartlett's Test of Sphericity | Approx. Chi-Square | 3784.381 |
| df | 231 | |
| Sig. | .000 | |
Fig 1: The Kaiser-Meyer-Olkin Measure of Adequacy (KMO)
Total Variance Explained
| Component | Initial Eigenvalues | Extraction Sums of Squared Loadings | Rotation Sums of Squared Loadings | ||||||
|---|---|---|---|---|---|---|---|---|---|
| Total | % of Variance | Cumulative % | Total | % of Variance | Cumulative % | Total | % of Variance | Cumulative % | |
| 1 | 7.565 | 34.387 | 34.387 | 7.565 | 34.387 | 34.387 | 4.200 | 19.089 | 19.089 |
| 2 | 2.636 | 11.980 | 46.367 | 2.636 | 11.980 | 46.367 | 3.163 | 14.379 | 33.468 |
| 3 | 2.249 | 10.224 | 56.591 | 2.249 | 10.224 | 56.591 | 2.765 | 12.569 | 46.037 |
| 4 | 1.230 | 5.590 | 62.181 | 1.230 | 5.590 | 62.181 | 2.313 | 10.516 | 56.553 |
| 5 | 1.022 | 4.646 | 66.827 | 1.022 | 4.646 | 66.827 | 2.260 | 10.274 | 66.827 |
| 6 | .992 | 4.511 | 71.338 | ||||||
| 7 | .788 | 3.582 | 74.920 | ||||||
| 8 | .626 | 2.847 | 77.767 | ||||||
| 9 | .601 | 2.731 | 80.498 | ||||||
| 10 | .546 | 2.484 | 82.981 | ||||||
| 11 | .512 | 2.329 | 85.311 | ||||||
| 12 | .484 | 2.199 | 87.509 | ||||||
| 13 | .410 | 1.865 | 89.374 | ||||||
| 14 | .367 | 1.670 | 91.044 | ||||||
| 15 | .352 | 1.602 | 92.646 | ||||||
| 16 | .334 | 1.517 | 94.163 | ||||||
| 17 | .299 | 1.358 | 95.521 | ||||||
| 18 | .265 | 1.206 | 96.727 | ||||||
| 19 | .235 | 1.070 | 97.797 | ||||||
| 20 | .230 | 1.047 | 98.844 | ||||||
| 21 | .152 | .690 | 99.534 | ||||||
| 22 | .103 | .466 | 100.000 | ||||||
Extraction Method: Principal Component Analysis.
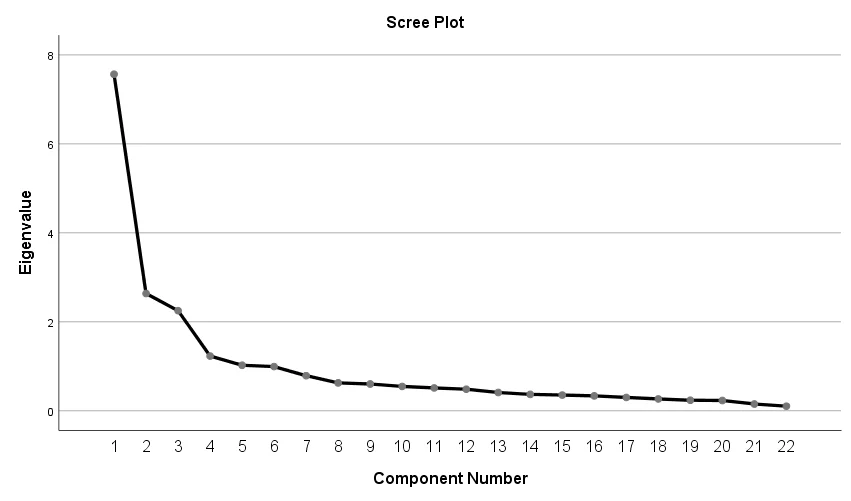
Fig 3: Scree Plot of Eigenvalue against component number
Results:
- Number of Factors Determination: A crucial aspect of this analysis was to ascertain the appropriate number of factors to extract. Following a meticulous review of the Total Variance Explained table, it is recommended that five factors be extracted for individual orientation. These five components cumulatively account for 91.044% of the variance, which ensures a robust representation of the data.
- Factor Labels and Interpretation:
- Factor 1: Customer Satisfaction/Relationship - Characterized by items related to customer satisfaction, customer loyalty, and customer relationships. Items such as cr1 (customer satisfaction), cr2 (customer loyalty), and cr3 (customer relationships) were found to be associated with this factor.
- Factor 2: Regulatory Compliance - Comprising items associated with regulatory compliance, such as rd1 (compliance), rd2 (regulatory compliance), and rd3 (regulatory requirements).
- Factor 3: Risk Management - Characterized by items related to risk management, including items such as ra1 (risk management), ra2 (risk assessment), and rc1 (risk control).
- Factor 4: Data Security - Encompassing items related to data security, such as rc2 (data security), rc3 (data privacy), and lc4 (data encryption).
- Factor 5: Process Automation - Comprising items related to process automation, including ap1 (automation), ap2 (process automation), and ap3 (automation of processes).
- Convergent Validity: The data analysis revealed a strong relationship between the individual orientation measures, as evidenced by the total variance explained, amounting to 95.521% with the first five components. This underlines the presence of a high degree of convergent validity among the measures.
- Discriminant Validity: The Component Transformation Matrix and Component Score Coefficient Matrix highlighted a clear lack of substantial relationships between individual orientation measures. This outcome signifies a noteworthy level of discriminant validity, emphasizing the distinct nature of each measure.
Implications:
The emergence of these factors bears significant implications:
- Causal Model Development:These extracted factors serve as the foundation for constructing a causal model, enabling a deeper understanding of how these factors interplay and influence productivity or performance among employees. For instance, Factor 1, which relates to customer satisfaction and relationships, can be employed to measure employee responsibility and autonomy.
- Predictive Variables: In the context of predicting productivity or performance, a range of independent variables can be considered. Job satisfaction, job involvement, job commitment, job motivation, and job performance are potential predictors. External factors like the economic climate and resource availability can also play a crucial role in predicting performance. Moreover, the physical and mental health of employees are valuable variables in predicting performance outcomes.
Conclusion:
This exploratory factor analysis of Del Group's individual orientation measures not only showcases the structure, reliability, and validity of the data but also opens the door to a wealth of possibilities for future research and applications in understanding and forecasting employee performance. The robustness of the analysis and the implications drawn provide a solid basis for decision-making and strategy development in the organization.
Similar Samples
Explore our extensive sample library dedicated to statistics assignments. From basic concepts to complex problem-solving, our samples provide valuable insights and examples to aid your learning. Whether you're a student seeking study materials or simply curious about statistical analysis, our diverse collection has something for everyone. Immerse yourself in our samples and enhance your understanding of statistical principles.
Statistics
Statistics
Statistics
Statistics
Statistics
Statistics
Statistics
Statistics
Statistics
Statistics
Statistics
Statistics
Statistics
Statistics
Statistics
Statistics
Statistics
Statistics
Statistics
Statistics