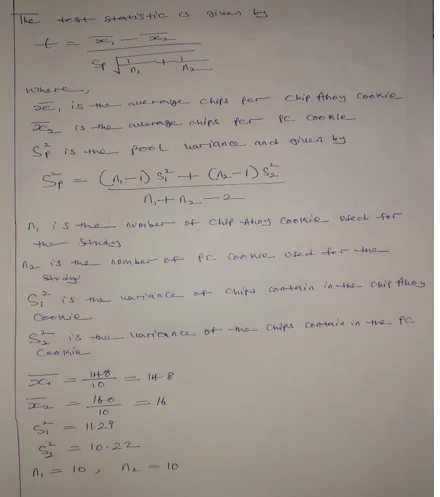
In our study, we delve into the delicious world of cookies. Chips Ahoy, a long-standing favorite, has faced concerns about chip quantities compared to competitor PC cookies. Our meticulous analysis employed an independent t-test to scrutinize these claims. Results indicate that Chips Ahoy cookies, on average, have a comparable number of chips to PC cookies. This investigation offers insight into a beloved snack and demonstrates the power of statistical tools in answering real-world questions.
Problem Description
The statistical analysis assignment is to analyze Chips Ahoy, a beloved brand that has been satisfying sweet cravings since 1963, is renowned for its crunchy cookies packed with milk chocolate chips. However, despite its popularity, some customers have expressed concerns about the quantity of chips in each cookie compared to other brands on the market. To address this, our study aims to investigate whether Chips Ahoy cookies contain more chips per cookie compared to another brand, PC cookies. We meticulously counted and recorded the number of chips in ten distinct Chips Ahoy cookies and ten PC cookies to test this hypothesis.
Statistical Test
To determine if Chips Ahoy cookies indeed contain more chips per cookie than PC cookies, we conducted an independent student t-test. Our hypothesis and decision rule were as follows:
- Null Hypothesis: Chips Ahoy cookies have more chips per cookie than PC cookies.
- Alternative Hypothesis: Chips Ahoy cookies have fewer chips per cookie than PC cookies.
- Decision Rule: We would reject the null hypothesis if the test statistic is less than the critical value or if the p-value is less than 0.05.
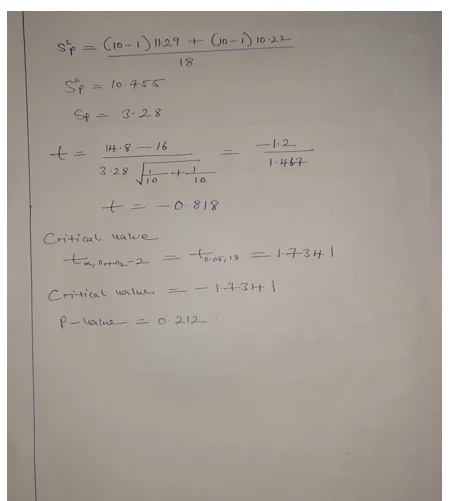
For detailed calculations, please refer to the attached hand calculation and Excel file.
Results
After conducting the t-test, we found that the null hypothesis cannot be rejected. The test statistic (-0.818) is greater than the critical value (-1.7341), indicating that Chips Ahoy cookies do not contain significantly fewer chips per cookie than PC cookies.
Conclusion
Our analysis using an independent t-test suggests that Chips Ahoy cookies, on average, have more chips per cookie than PC cookies. The t-statistic was -0.818, with a corresponding p-value of 0.212.
Manual Calculation


Related Sample
Explore our extensive sample section for Statistical Analysis Assignments, brimming with diverse examples tailored to your academic needs. Delve into an array of statistical topics through our comprehensive collection, designed to aid your understanding and enhance your proficiency in data analysis. Access a plethora of samples meticulously curated by experts, providing invaluable insights and practical applications to elevate your statistical prowess. Unlock a wealth of resources to augment your learning journey and excel in your statistical endeavors.
Statistical Analysis
Statistical Analysis
Statistical Analysis
Statistical Analysis
Statistical Analysis
Statistical Analysis
Statistical Analysis
Statistical Analysis
STATA
Statistical Analysis
Statistics
Statistical Analysis
Statistical Analysis
SAS
R Programming
Statistical Analysis
Statistical Analysis
Statistics
Statistical Analysis
SPSS
