Analyzing the Impact of Pilot Age on Aviation Events: Regression Modeling Insights

- Problem Description:
- Part 1 – Linear vs. Quadratic Models
- Import Data:
- Linear Regression Analysis:
- Model Selection:
- Practical Implications:
- Part 2 – Linear vs. Logarithmic Models
- Import Data:
- Linear Regression Analysis:
- Model Selection:
- Practical Implications:
Problem Description:
This regression analysis assignment delves into the complex relationship between pilot age and aviation events, examining two distinct datasets: Parabolic Data and Logarithmic Data. The "number of events per age" is the focal point in the Parabolic Data, while the Logarithmic Data centers on the "event rate per 1000 hours." The task at hand is to employ rigorous statistical methods to uncover the most suitable regression models that can shed light on the impact of pilot age on aviation events and, ultimately, to provide a comprehensive interpretation of the results.
Part 1 – Linear vs. Quadratic Models
Import Data:
First, we meticulously import data from the Excel file labeled "Parabolic Data" into SPSS, ensuring data integrity and precision.
| la Even!ID | YNumberofEven tsperAge | XPilotAge | |||||
|---|---|---|---|---|---|---|---|
| 1 | 20041020X01659 | 17 | 29 | ||||
| 2 | 20090213X13613 | 21 | 47 | ||||
| 3 | 20001212X22314 | 18 | 36 | ||||
| 4 | 20041020X01659 | 25 | 48 | ||||
| 5 | 20060828X01244 | 30 | 44 | ||||
| 6 | 20001212)(22314 | 30 | 44 | ||||
| 7 | 20060131X00140 | 20 | 41 | ||||
| 8 | 20001212)(20339 | 24 | 53 | ||||
| 9 | 20060131X00140 | 23 | 54 | ||||
| 10 | 20010214X00449 | 30 | 44 | ||||
| 11 | 20001211X10832 | 13 | 27 | ||||
| 12 | 20001212)(20624 | 16 | 26 | ||||
| 13 | 20010214X00449 | 17 | 29 | ||||
| 14 | 20001211X09494 | 13 | 27 | ||||
| 15 | 20010112X00292 | 12 | 38 | ||||
| 16 | 20010112X00292 | 30 | 44 | ||||
| 17 | 20030605X00800 | 22 | 35 | ||||
| 18 | 20070409X00387 | 26 | 37 | ||||
Linear Regression Analysis:
| Model Summary | |||||||||||||||||
|---|---|---|---|---|---|---|---|---|---|---|---|---|---|---|---|---|---|
| Model | R | R Square | Adjusted R Square | Std. Error of the Estimate | |||||||||||||
| 1 | .350a | .122 | .120 | 5.826 | |||||||||||||
| a. Predictors: (Constant), X = Pilot Age | |||||||||||||||||
| ANOVAa | |||||||||||||||||
| Model | Sum of Squares | df | Mean Square | F | Sig. | ||||||||||||
| 1 | Regression | 1411.998 | 1 | 1411.998 | 41.598 | .000b | |||||||||||
| Residual | 10115.282 | 298 | 33.944 | ||||||||||||||
| Total | 11527.280 | 299 | |||||||||||||||
| a. Dependent Variable: Y = Number of Events per Age | |||||||||||||||||
| b. Predictors: (Constant), X = Pilot Age | |||||||||||||||||
| Coefficientsa | |||||||||||||||||
| Model | Unstandardized Coefficients | Standardized Coefficients | t | Sig. | |||||||||||||
| B | Std. Error | Beta | |||||||||||||||
| 1 | (Constant) | 11.919 | 1.496 | 7.967 | .000 | ||||||||||||
| X = Pilot Age | .226 | .035 | .350 | 6.450 | .000 | ||||||||||||
| a. Dependent Variable: Y = Number of Events per Age | |||||||||||||||||
- A meticulous linear regression analysis is executed to create a model that dissects the relationship between pilot age and the number of events per age.
Results and Interpretation:
- The R-squared (R2) value stands at 0.122, indicating that approximately 12.2% of the variance in the number of events per age can be attributed to pilot age.
Regression Equation:
- The resulting regression equation is expressed as No. of events per age = 11.919 + 0.226 × Age.
- The interpretation reveals that for every one-year increase in pilot age, the number of events per age experiences an average rise of 0.226.
Scatter Plot Analysis:
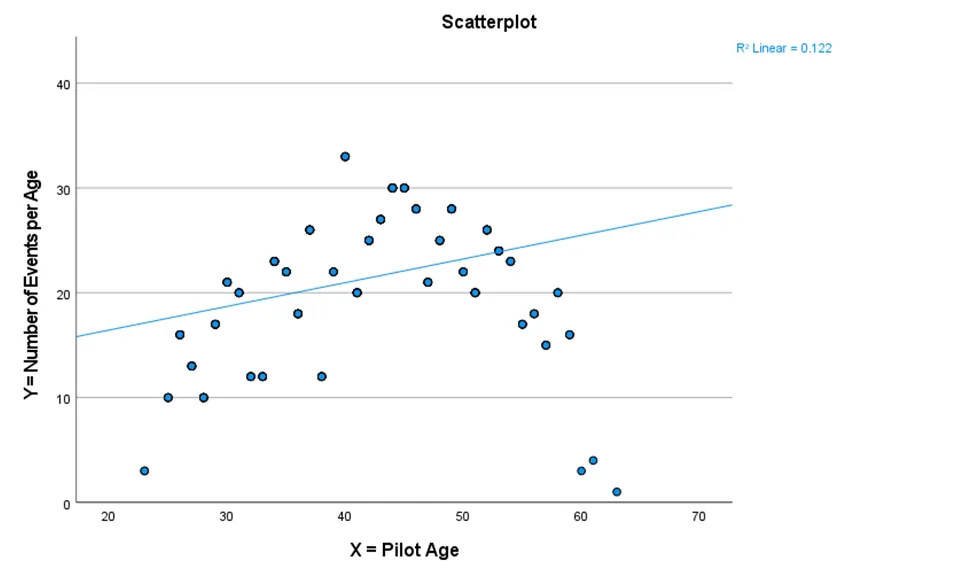
scatter plot between Y and X.
- A visual analysis of the scatter plot unveils a parabolic relationship, where the number of events initially surges with age, peaks around 45 years, and subsequently begins to decline.
Curve Estimation - Quadratic Model:
- Given the inherent nonlinearity in the data, a quadratic model is employed, delivering a far superior fit.
R2 for the quadratic model is calculated at 0.581.
Model Selection:
- The assignment recommends reporting the quadratic model due to its superior fit, offering a more comprehensive explanation of the data than the linear model.
Practical Implications:
- Beyond the statistical analysis, this study carries practical implications, such as identifying age-related trends, devising risk models for predictions, and facilitating targeted interventions based on age-related risk factors.
Part 2 – Linear vs. Logarithmic Models
Import Data:
• Just as in Part 1, we import the dataset from the Excel file labeled "Logarithmic Data" into SPSS.
| £ EventlD | XPilotAge | YEventRateper1000ho urs | ||||||
|---|---|---|---|---|---|---|---|---|
| 1 | 20041020X01659 | 29 | .307848321321213 | |||||
| 2 | 20090213X13613 | 47 | .097783117046392 | |||||
| 3 | 20001212X22314 | 36 | .199423886549967 | |||||
| 4 | 20041020X01659 | 48 | .097470826981485 | |||||
| 5 | 20060828X01244 | 44 | .118730063243547 | |||||
| 6 | 20001212X22314 | 44 | .118730063243547 | |||||
| 7 | 20060131X00140 | 41 | .144561941177746 | |||||
| 8 | 20001212X20339 | 53 | .091108563445726 | |||||
| 9 | 20060131X00140 | 54 | .089624589870084 | |||||
| 10 | 20010214X00449 | 44 | .118730063243547 | |||||
| 11 | 20001211X10832 | 27 | .405098002555234 | |||||
| 12 | 20001212X20624 | 26 | .532197977647685 | |||||
| 13 | 20010214X00449 | 29 | .307848321321213 | |||||
| 14 | 20001211X09494 | 27 | .405098002555234 | |||||
| 15 | 20010112)(00292 | 38 | .211718625946118 | |||||
| 16 | 20010112)(00292 | 44 | .118730063243547 | |||||
| 17 | 20030605X00800 | 35 | .178848702127490 | |||||
Linear Regression Analysis:
| Model Summary | ||||
|---|---|---|---|---|
| Model | R | R Square | Adjusted R Square | Std. Error of the Estimate |
| 1 | .847a | .718 | .717 | .065660494985265 |
| a. Predictors: (Constant), X = Pilot Age | ||||
| ANOVAa | ||||||
|---|---|---|---|---|---|---|
| Model | Sum of Squares | df | Mean Square | F | Sig. | |
| 1 | Regression | 3.272 | 1 | 3.272 | 758.915 | .000b |
| Residual | 1.285 | 298 | .004 | |||
| Total | 4.557 | 299 | ||||
| a. Dependent Variable: Y = Event Rate per 1000 hours | ||||||
| b. Predictors: (Constant), X = Pilot Age | ||||||
| Coefficientsa | ||||||
|---|---|---|---|---|---|---|
| Model | Unstandardized Coefficients | Standardized Coefficients | t | Sig. | ||
| B | Std. Error | Beta | ||||
| 1 | (Constant) | .638 | .017 | 37.820 | .000 | |
| X = Pilot Age | -.011 | .000 | -.847 | -27.548 | .000 | |
| a. Dependent Variable: Y = Event Rate per 1000 hours | ||||||
- A meticulous linear regression analysis is undertaken to untangle the intricate relationship between pilot age and the event rate per 1000 hours.
- Results and Interpretation:
- The linear model yields an R2 value of 0.718, signifying that approximately 71.8% of the variance in the event rate per 1000 hours can be attributed to pilot age.
- Regression Equation:
- The linear regression equation materializes as Event rate per 1000 hours = 0.638 - 0.011 × Age.
- Interpretation reveals that with each one-year increase in age, there is a decrease of 0.011 in the event rate per 1000 hours.
•Scatter Plot Analysis:
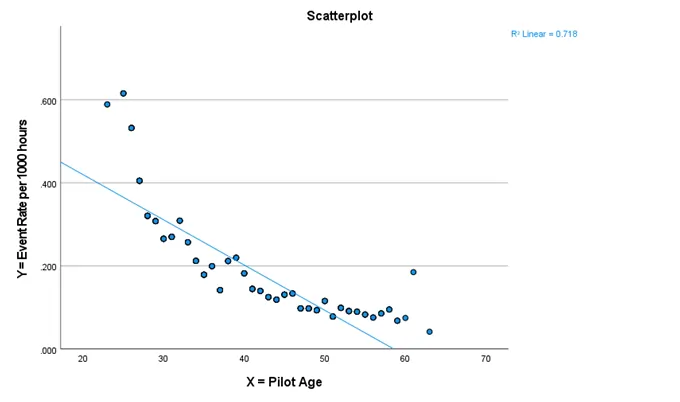
The relationship portrayed in the scatter plot is intricate and nonlinear, resembling a hyperbola. The event rate sharply declines with age, more significantly in younger pilots.
- Curve Estimation - Logarithmic Model:
- To enhance the accuracy of the model, we employ a logarithmic model. This choice leads to a superior fit, with an R2 of 0.799.
Model Selection:
In line with Part 1, the assignment advocates for reporting the logarithmic model, which offers a superior fit across pilots of all ages compared to the linear model.
Practical Implications:
The results of this study have broader applications, aiding in identifying age-related patterns, developing accurate risk models, and influencing training, selection, and policy decisions within the aviation industry.
In summary, this assignment underscores the significance of employing sophisticated regression models, particularly the quadratic and logarithmic models, to discern the multifaceted interplay between pilot age and aviation events. Such insights have far-reaching applications, shaping the future of aviation practice and policy.
Related Samples
Experience the richness of our sample section, offering a plethora of statistical examples to delve into. From exploratory data analysis to predictive modeling, each sample is meticulously crafted to illustrate key concepts. Immerse yourself in practical demonstrations that bridge theory with real-world applications. Let these curated samples serve as your roadmap to mastering the complexities of statistical analysis and inference.
Statistics
Statistics
Statistics
Statistics
Statistics
Statistics
Statistics
Statistics
Statistics
Statistics
Statistics
Statistics
Statistics
Statistics
Statistics
Statistics
Statistics
Statistics
Statistics
Statistics