Analyzing Spatial and Temporal Variability in Maximum Temperatures in California (2012)

- Problem Description:
This study seeks to unravel the intricate patterns of spatial and temporal variability in maximum temperatures across California during the year 2012. By focusing on Napa and Death Valley, pivotal regions with diverse climatic conditions, the analysis aims to enhance our understanding of temperature fluctuations. The investigation addresses critical questions related to the predictability of maximum temperatures using spatial and time series models. Through rigorous examination, this research endeavors to contribute valuable insights to sectors crucially dependent on accurate temperature forecasts, such as agriculture, energy, and public health.
Problem Description:
This time series analysis delves into the spatial and temporal dynamics of maximum temperatures across California during 2012. The study aims to provide valuable insights for sectors such as agriculture, energy, and public health, enabling preparedness for extreme weather events and fostering sustainable practices. Key questions addressed include predicting temperatures in specific locations using spatial and time series models and assessing the model's generalizability across California.
Initial Data Analysis:
The analysis initiates with loading and preprocessing maximum temperature data for Napa and Death Valley on June 4th, 2012. Employing Inverse Distance Weighting (IDW) interpolation, a spatial model is crafted, visualizing temperature distributions across California on a 0.1° grid. Simultaneously, an ARIMA(0,1,3) time series model is applied to forecast maximum temperatures in Napa from June 4th to 8th, 2012.
Methods:
For spatial predictions, Inverse Distance Weighting (IDW) is utilized, calculating predicted values based on weighted averages of neighboring temperature values. Time series forecasting employs an ARIMA(0,1,3) model, chosen through autocorrelation and partial autocorrelation plots to determine lag orders.
Results:
The IDW spatial model effectively predicts maximum temperatures for Napa and Death Valley on June 4th, 2012. The ARIMA(0,1,3) model demonstrates a good fit for Napa, with coefficients ma1 = -0.2116, ma2 = -0.3564, ma3 = -0.2505. Box-Pierce test results confirm no significant autocorrelation in the residuals.
Model Appropriateness for Other Locations:
The ARIMA(0,1,3) model is tested on locations such as San Francisco, Santa Cruz, Fresno, Death Valley, Barstow, LA, CedarPark, and Redding. Results indicate the model's competence in capturing temperature trends across various regions.
.webp)
Figure 1: Map of predicted temperatures and uncertainties on a 0.1 ͦ grid over California
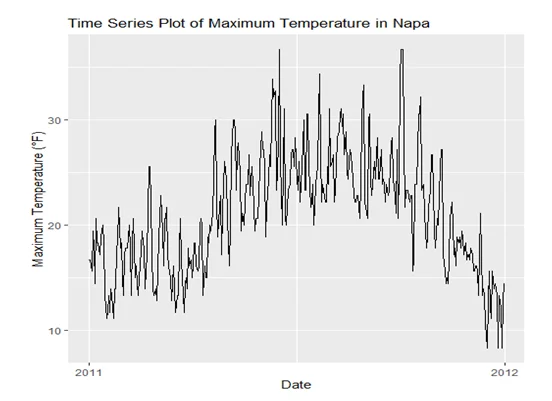
Figure 2: Time series plot of maximum temperature in Napa
Summary:
The analysis offers valuable insights into California's maximum temperature patterns in 2012. While the spatial model effectively predicts temperatures in Napa and Death Valley, the ARIMA(0,1,3) model demonstrates accuracy for Napa and potential for generalizability. Further validation and testing are recommended for broader applicability. The findings contribute to decision-making in climate adaptation and resource management, emphasizing the significance of understanding both spatial and temporal temperature patterns.
Related Sample
Explore a myriad of data analysis samples tailored to various topics on our website. Delve into an array of case studies, projects, and assignments showcasing statistical methodologies and analytical insights. Whether it's regression analysis, hypothesis testing, or data visualization, find diverse examples to enhance your understanding. Navigate through our comprehensive sample section to enrich your knowledge and sharpen your data analysis skills.
Data Analysis
Data Analysis
Data Analysis
Data Analysis
Statistics
Data Analysis
tableau
Data Analysis
Data Analysis
Data Analysis
Data Analysis
Data Analysis
Data Analysis
R Programming
Data Analysis
Data Analysis
Data Analysis
Data Analysis
Data Analysis
Data Analysis