How to Approach Statistical Assignments Using Hypothesis Testing and Categorical Data Analysis

Claim Your Offer
Unlock an exclusive deal at www.statisticsassignmenthelp.com with our Spring Semester Offer! Get 10% off on all statistics assignments and enjoy expert assistance at an affordable price. Our skilled team is here to provide top-quality solutions, ensuring you excel in your statistics assignments without breaking the bank. Use Offer Code: SPRINGSAH10 at checkout and grab this limited-time discount. Don’t miss the chance to save while securing the best help for your statistics assignments. Order now and make this semester a success!
We Accept


- Understanding Hypothesis Testing in Statistical Assignments
- Key Concepts in Hypothesis Testing
- Steps to Conduct Hypothesis Testing
- Categorical Data Analysis and Chi-Square Tests
- Chi-Square Test for Independence
- Steps to Perform a Chi-Square Test:
- Additional Considerations in Statistical Analysis
- Real-World Applications of Hypothesis Testing and Categorical Data Analysis
- Conclusion
Statistical assignments often involve hypothesis testing, categorical data analysis, and probability-based interpretations. These assignments require students to apply fundamental statistical concepts such as the null and alternative hypotheses, p-values, chi-square tests, and mean differences. Successfully tackling such assignments necessitates a deep understanding of statistical principles and their application to real-world data. If you're looking to solve your hypothesis testing assignment effectively, this blog will provide a structured approach, emphasizing best practices and common pitfalls to avoid. By following a clear and methodical approach, students can develop better problem-solving strategies, making their analyses more precise and reliable.
Additionally, understanding how to properly implement statistical techniques not only aids in academic success but also enhances analytical thinking, which is crucial for research and data-driven decision-making. Developing proficiency in these areas can significantly improve the accuracy of conclusions and overall comprehension of statistical methodologies, ensuring that students are well-equipped for future challenges in data analysis.

Understanding Hypothesis Testing in Statistical Assignments
Hypothesis testing is central to many statistical analyses. It involves making inferences about population parameters based on sample data, helping researchers draw meaningful conclusions. This process is fundamental in determining whether observed patterns in data are a result of random chance or if there is a statistically significant underlying effect. By comparing sample statistics to known population parameters, hypothesis testing allows analysts to evaluate claims and validate theoretical assumptions. It is widely used across various fields, including economics, medicine, social sciences, and engineering, to test relationships between variables. A well-structured hypothesis test follows rigorous steps, ensuring accurate and reliable interpretations of data.
Key Concepts in Hypothesis Testing
- Null Hypothesis (H₀): Assumes no effect or no difference. It serves as the default assumption in statistical analysis.
- Alternative Hypothesis (H₁): Suggests a statistically significant effect or difference.
- Significance Level (α): The threshold for determining statistical significance, commonly set at 0.05.
- Test Statistic: A numerical value used to determine whether to reject H₀.
- p-Value: The probability of obtaining a test statistic as extreme as the one observed, assuming H₀ is true.
- Decision Rule:
If p-value < α, H₀ is rejected in favor of H₁.
Steps to Conduct Hypothesis Testing
- Define the Hypotheses
- Clearly state H₀ and H₁ based on the research question.
- Example: In a study of marriage ages, H₀ may be that the mean age difference between husbands and wives is zero.
- Choose the Appropriate Statistical Test
- If comparing means, use a t-test.
- If analyzing categorical data, use a chi-square test.
- Determine the Significance Level (α)
- Typically set at 0.05, meaning a 5% probability of rejecting H₀ incorrectly.
- Compute the Test Statistic
- Example: In a paired sample t-test, the test statistic is calculated as:
- Find the p-Value and Make a Decision
If p < x, reject H₀; otherwise, do not reject H₀.- Example: A p-value of 0.03 suggests strong evidence against H₀.


Categorical Data Analysis and Chi-Square Tests
Categorical data assignments often involve evaluating associations between variables to determine potential relationships. The chi-square test is widely used in such cases, making it an essential tool for statistical analysis. This test helps researchers assess whether observed categorical data distributions differ significantly from expected distributions under a given hypothesis. Understanding how to analyze categorical data is crucial for students working with survey results, medical studies, and market research, as it allows them to make data-driven conclusions. Mastery of categorical data analysis enhances a student's ability to work with contingency tables, interpret p-values, and understand the implications of statistical significance.
Chi-Square Test for Independence
This test determines whether two categorical variables are independent.
Steps to Perform a Chi-Square Test:
- Set Up the Hypotheses
- H₀: No association between the two categorical variables.
- H₁: An association exists.
- Create a Contingency Table
- Example: A study on baldness and heart disease categorizes individuals into different groups.
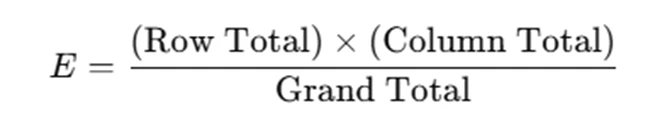
- Calculate the Expected Frequencies
- Expected frequency formula:
- Compute the Chi-Square Statistic
- The formula is:
- Compare with the Critical Value
- If x2 is greater than the critical value, reject H₀.
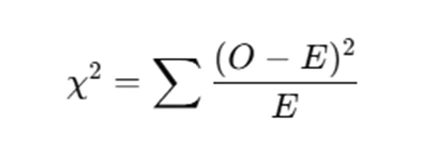
where o is the observed frequency, and E is the expected frequency.
Additional Considerations in Statistical Analysis
Beyond hypothesis testing and categorical data analysis, other essential considerations ensure robust statistical conclusions. Understanding effect sizes helps determine the practical significance of results, providing deeper insights beyond mere statistical significance. Checking assumptions such as normality, homogeneity of variance, and independence ensures the validity of chosen statistical tests. Additionally, proper data visualization aids in identifying patterns, outliers, and trends before conducting formal analyses. Avoiding common pitfalls, such as p-hacking and misinterpreting p-values, strengthens the credibility of findings. Finally, acknowledging the limitations of a study and ensuring transparent reporting practices contribute to ethical and responsible statistical analysis.
- Effect Size Considerations
- Statistical significance does not always imply practical importance.
- Effect size measures such as Cohen’s d for t-tests or Cramér’s V for chi-square tests help assess practical significance.
- Limitations and Generalizability
- If data are not randomly sampled, conclusions must be interpreted with caution.
- Statistical results should always be contextualized within the study's limitations.
- Common Pitfalls in Statistical Analysis
- Misinterpreting p-values: A low p-value does not confirm H₁, it only suggests evidence against H₀.
- Ignoring effect size: Even if a result is statistically significant, it may not be practically meaningful.
- Violating assumptions: Each statistical test has assumptions that must be met for valid conclusions.
Real-World Applications of Hypothesis Testing and Categorical Data Analysis
- Medical Studies: Testing the effectiveness of new drugs or treatments.
- Social Sciences: Analyzing survey data to determine relationships between variables.
- Market Research: Understanding consumer behavior through statistical analysis.
- Engineering and Quality Control: Ensuring products meet industry standards.
Conclusion
Solving statistical assignments requires careful hypothesis formulation, appropriate test selection, and accurate interpretation of results. By following structured steps in hypothesis testing and categorical data analysis, students can enhance their analytical skills and produce meaningful statistical insights. A deep understanding of statistical techniques allows students to apply these methods in real-world scenarios, making their findings more reliable and impactful. Moreover, mastering these methods helps students develop critical thinking skills necessary for evaluating data, identifying trends, and drawing valid conclusions. Understanding the nuances of different statistical tests ensures that students can confidently approach assignments, minimizing errors and enhancing the credibility of their work. The ability to properly analyze data is not only beneficial for academic success but also essential in professional and research settings. Developing a strong foundation in statistics enables students to contribute valuable insights, supporting evidence-based decision-making across various disciplines. If you're looking to complete your statistics assignment with precision, gaining a comprehensive understanding of these techniques will undoubtedly pave the way for academic excellence.