How to Solve Statistical Assignments Using Correlation, t-Tests, and ANOVA

Claim Your Offer
Unlock a fantastic deal at www.statisticsassignmenthelp.com with our latest offer. Get an incredible 10% off on all statistics assignment, ensuring quality help at a cheap price. Our expert team is ready to assist you, making your academic journey smoother and more affordable. Don't miss out on this opportunity to enhance your skills and save on your studies. Take advantage of our offer now and secure top-notch help for your statistics assignments.
We Accept


- Understanding the Assignment Requirements
- Step 1: Data Exploration and Quality Evaluation
- Descriptive Statistics
- Checking Assumptions
- Missing Data Treatment
- Step 2: Formulating the Hypotheses
- Step 3: Conducting t-Tests for Group Comparisons
- By-Hand Computation of a Two-Group t-Test
- Using Statistical Software
- Step 4: Conducting One-Way ANOVA for Multiple Group Comparisons
- By-Hand Computation of One-Way ANOVA
- Using Statistical Software
- Step 5: Comparing Results from t-Tests and ANOVA
- Effect Size Interpretation
- Step 6: Regression Analysis for Predictive Modeling
- Simple Linear Regression Equation
- Step 7: Interpreting Results and Making Recommendations
- Conclusion
Statistical assignments often require students to analyze datasets using fundamental techniques like correlation, t-tests, and ANOVA models. These methods help in determining relationships between variables, testing hypotheses, and comparing groups to make data-driven conclusions. Mastering these techniques is essential for students in fields such as psychology, economics, business, and the sciences, where statistical analysis plays a crucial role in research and decision-making. Whether you are working with small datasets or large, complex ones, understanding how to apply these statistical tests correctly ensures accuracy in your results and interpretations.
To successfully solve your statistics assignment, it is crucial to follow a structured approach that includes data exploration, checking assumptions, selecting the appropriate statistical test, and interpreting the findings logically. Many students struggle with statistical concepts because of their technical nature, but breaking down the process into manageable steps makes it easier to grasp. This blog provides a comprehensive guide on how to approach and solve such assignments while ensuring statistical rigor and clarity in interpretation. By following these principles, students can gain confidence in their statistical skills and apply them effectively in real-world scenarios, enhancing both their academic and professional growth.

Understanding the Assignment Requirements
Before diving into data analysis, carefully read the assignment requirements. Assignments typically involve:
- Evaluating data quality through descriptive analysis.
- Testing statistical assumptions such as normality and homogeneity of variance.
- Performing hypothesis tests like t-tests and ANOVA.
- Comparing results from manual computations and statistical software.
The primary goal is to draw meaningful conclusions from the data while ensuring that all statistical assumptions are met.
Step 1: Data Exploration and Quality Evaluation
Descriptive Statistics
Begin by summarizing the dataset through measures of central tendency (mean, median, mode) and variability (standard deviation, variance, range). This helps in understanding the data distribution before proceeding with formal statistical tests.
Checking Assumptions
- Normality: Use visual methods (histograms, Q-Q plots) and formal tests (Shapiro-Wilk test) to assess if the data follows a normal distribution.
- Influential Outliers: Identify outliers using boxplots and the IQR rule. Extreme values can distort results and should be treated appropriately.
- Variance Homogeneity: Levene’s Test or Bartlett’s Test can confirm if different groups have equal variance, which is essential for ANOVA.
Missing Data Treatment
Missing data can bias results, so handling it properly is crucial. Common methods include:
- Listwise Deletion: Removing cases with missing values.
- Mean/Median Imputation: Replacing missing values with the mean or median.
- Multiple Imputation: Using statistical modeling to estimate missing values.
Step 2: Formulating the Hypotheses
Statistical analysis is grounded in hypothesis testing. Before conducting any test, define:
- Null Hypothesis (H₀): Assumes no difference or no effect (e.g., “There is no difference in academic self-confidence between Classroom 1 and Classroom 2”).
- Alternative Hypothesis (H₁): Suggests a difference exists (e.g., “There is a difference in academic self-confidence between Classroom 1 and Classroom 2”).
Clearly defining these hypotheses helps in selecting the appropriate statistical test and ensures objectivity in analysis.
Step 3: Conducting t-Tests for Group Comparisons
A t-test is used to compare means between two groups.
By-Hand Computation of a Two-Group t-Test
The test statistic is computed as:
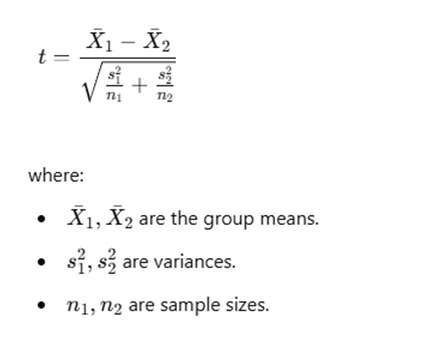
If the calculated t-value exceeds the critical value from the t-distribution table (based on degrees of freedom), we reject the null hypothesis.
Using Statistical Software
- Perform an independent samples t-test.
- Check p-values
- Interpret whether the difference between groups is statistically significant.
Step 4: Conducting One-Way ANOVA for Multiple Group Comparisons
ANOVA is used when comparing more than two groups.
By-Hand Computation of One-Way ANOVA
1. Compute Mean Square Between Groups (MSB):
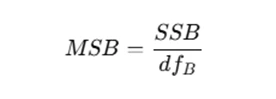
where SSB is the sum of squares between groups and df_B is the degrees of freedom between groups.
2. Compute Mean Square Within Groups (MSW):
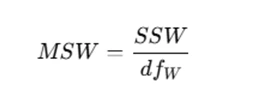
where SSW is the sum of squares within groups and df_W is the degrees of freedom within groups.
3. Compute the F-statistic:
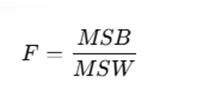
4. Compare the F-value to the critical F-value from statistical tables.
5. If the computed F-value is greater than the critical value, reject the null hypothesis.
Using Statistical Software
- Run a one-way ANOVA.
- Check F-test results and p-values.
- Validate assumptions (normality, homogeneity of variance).
- Compare results with manual calculations.
Step 5: Comparing Results from t-Tests and ANOVA
Both t-tests and ANOVA examine differences between means, but their applications differ:
- t-test is used for two groups.
- ANOVA is used for more than two groups.
- For two groups, t-test and one-way ANOVA should yield the same result.
Effect Size Interpretation
- Cohen’s d: Measures the effect size in t-tests.
- Eta-Squared (n2): Measures the effect size in ANOVA.
- Larger effect sizes indicate stronger relationships between variables.
Step 6: Regression Analysis for Predictive Modeling
Regression analysis allows predicting an outcome variable based on predictor variables.
Simple Linear Regression Equation
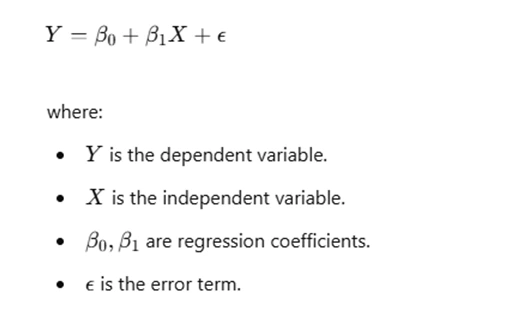
Regression results provide insights into how predictor variables influence the outcome and whether the model fits the data well.
Step 7: Interpreting Results and Making Recommendations
- If results show a significant difference, determine practical implications (e.g., should Classroom 1 adopt a different teaching method?).
- If assumptions are violated, consider non-parametric alternatives like the Mann-Whitney U test.
- Report confidence intervals to provide a range of plausible effect sizes.
- Provide actionable recommendations based on statistical findings.
Conclusion
Successfully solving statistical assignments requires a structured approach: exploring data, verifying assumptions, choosing the appropriate test, and interpreting results correctly. Understanding the relationship between different statistical methods, such as t-tests and ANOVA, allows for deeper insights into data and more informed conclusions. Always validate findings using statistical software and theoretical calculations to ensure accuracy and credibility in research outcomes. By mastering these techniques, students can confidently tackle statistical problems and make evidence-based recommendations.