How to Tackle SPSS Assignments Involving Descriptive and Inferential Statistics

Claim Your Offer
Unlock an exclusive deal at www.statisticsassignmenthelp.com with our Spring Semester Offer! Get 10% off on all statistics assignments and enjoy expert assistance at an affordable price. Our skilled team is here to provide top-quality solutions, ensuring you excel in your statistics assignments without breaking the bank. Use Offer Code: SPRINGSAH10 at checkout and grab this limited-time discount. Don’t miss the chance to save while securing the best help for your statistics assignments. Order now and make this semester a success!
We Accept


- Understanding the Structure of an SPSS-Based Assignment
- Organizing Data for Analysis
- Identifying Variables and Dataset Requirements
- Checking Data for Errors and Missing Values
- Conducting Descriptive Statistics
- Running Descriptive Statistics in SPSS
- Visualizing Data
- Common Graphical Techniques:
- Creating a Histogram with a Normal Curve in SPSS
- Performing Inferential Statistics
- Conducting a t-Test in SPSS
- Conducting a Chi-Square Test
- Running Regression Analysis
- Interpreting SPSS Outputs
- Conclusion
Statistical analysis is a fundamental part of research and data-driven decision-making across various fields. Many academic assignments require students to analyze datasets using Statistical Package for the Social Sciences (SPSS), a widely used statistical software. These assignments typically involve summarizing descriptive statistics, visualizing data, conducting inferential analyses, and interpreting the results based on SPSS outputs. While solving such assignments can seem daunting, understanding the step-by-step approach can make the process more manageable.
This blog provides a structured approach to solving SPSS-based assignments that involve both descriptive and inferential statistical techniques. It closely follows the nature of the assignment provided while remaining broad enough to be applicable to similar tasks. The discussion covers key elements such as data organization, descriptive analysis, graphical representation, hypothesis testing, and regression analysis. By the end of this guide, students will have a comprehensive understanding of how to approach and complete their SPSS assignments effectively.

Understanding the Structure of an SPSS-Based Assignment
SPSS assignments often follow a structured format, guiding students through different stages of statistical analysis. These assignments commonly include the following steps:
- Data preparation: Organizing and checking data for errors.
- Descriptive statistics: Summarizing the data using key measures.
- Data visualization: Using graphs and charts to illustrate distributions.
- Inferential statistics: Conducting hypothesis testing.
- Interpretation of results: Drawing conclusions based on statistical output.
Approaching an SPSS assignment methodically ensures accurate analysis and meaningful interpretations.
Organizing Data for Analysis
Identifying Variables and Dataset Requirements
Before conducting any analysis, it is essential to understand the dataset’s structure. Key steps include:
- Identifying dependent and independent variables.
- Recognizing measurement levels (nominal, ordinal, interval, or ratio).
- Understanding coding of categorical variables (e.g., 0 = no training, 1 = short-term training, 2 = long-term training in an SAT dataset).
- Checking for missing values and data inconsistencies.
Checking Data for Errors and Missing Values
Prior to running any tests, data integrity must be verified. This includes:
- Examining frequency distributions to detect anomalies.
- Checking for missing values and deciding on an imputation method.
- Assessing normality through histograms and skewness/kurtosis values.
Conducting Descriptive Statistics
Descriptive statistics provide an overview of the dataset by summarizing central tendencies and dispersions. Common metrics include:
- Measures of central tendency: Mean, median, mode.
- Measures of variability: Standard deviation, variance, range.
- Minimum and maximum values to assess data spread.
- Standard error of the mean for inferential applications.
Running Descriptive Statistics in SPSS
To compute these statistics in SPSS:
- Navigate to Analyze > Descriptive Statistics > Descriptives.
- Select the variable(s) to analyze.
- Choose statistics such as mean, standard deviation, variance, etc.
- Click OK and interpret the results.
Visualizing Data
Graphical representations aid in understanding the distribution and relationships of variables.
Common Graphical Techniques:
- Histograms: Assess normality and data distribution.
- Boxplots: Identify outliers and variability.
- Bar charts: Display frequency distributions for categorical variables.
- Scatterplots: Examine relationships between continuous variables.
Creating a Histogram with a Normal Curve in SPSS
- Go to Graphs > Chart Builder.
- Select Histogram and add it to the canvas.
- Assign the variable (e.g., SAT scores).
- Enable Show Normal Curve in Element Properties.
- Click OK and analyze the output.
Interpreting histograms involves checking symmetry, skewness, and outliers.
Performing Inferential Statistics
Inferential statistics allow researchers to draw conclusions about populations from sample data. Common techniques include:
- t-tests: Comparing means between two groups.
- ANOVA: Comparing means across multiple groups.
- Chi-square tests: Assessing associations between categorical variables.
- Correlation and regression: Evaluating relationships between variables.
Conducting a t-Test in SPSS
For example, if comparing SAT scores across different training groups, a One-Way ANOVA is appropriate:
- Navigate to Analyze > Compare Means > One-Way ANOVA.
- Select SAT scores as the dependent variable.
- Select Training Group as the independent variable.
- Click OK and review the output.
Key output components:
- F-statistic: Measures between-group vs. within-group variability.
- p-value:
Determines statistical significance (e.g., p < 0.05 suggests significant differences among groups). - Post-hoc tests to identify specific group differences.
Conducting a Chi-Square Test
For categorical variables like Wheezing (Yes/No) and Maternal Smoking (Yes/No):
- Go to Analyze > Descriptive Statistics > Crosstabs.
- Assign variables to Rows (e.g., Wheezing) and Columns (e.g., Smoker).
- Click Statistics and select Chi-Square.
- Click OK and interpret results.
Interpretation:
- Chi-square value: Measures the strength of the association.
- p-value:
If p < 0.05, the association is significant.
Running Regression Analysis
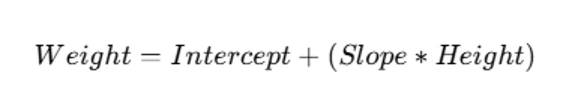
Regression predicts a dependent variable based on independent predictors. For example, predicting Weight based on Height:
- Go to Analyze > Regression > Linear.
- Select Weight as the dependent variable.
- Select Height as the independent variable.
- Click OK and review results.
Key components:
- Regression Equation:
- r-squared value: Indicates how much variance is explained.
- p-value for slope: Determines predictor significance.
Interpreting SPSS Outputs
Understanding SPSS output ensures accurate interpretation:
- Descriptive Statistics: What do mean, standard deviation, and variance reveal?
- t-test/ANOVA: Do means differ significantly based on p-values?
- Chi-Square Test: Is there a relationship between categorical variables?
- Regression Output: Does the predictor significantly influence the dependent variable?
Conclusion
SPSS assignments require a structured approach: understanding the dataset, selecting appropriate tests, running statistical analyses, and interpreting outputs. By mastering descriptive statistics, data visualization, hypothesis testing, and regression analysis, students can confidently solve their statistics assignment with accuracy. Following these step-by-step guidelines ensures clarity, precision, and meaningful insights from statistical data. Whether performing t-tests, ANOVA, Chi-Square tests, or Regression, a systematic approach leads to precise and well-supported conclusions in SPSS assignments.