Regression Essentials for Acing Your ERMA Assignments

Claim Your Offer
Unlock a fantastic deal at www.statisticsassignmenthelp.com with our latest offer. Get an incredible 10% off on all statistics assignment, ensuring quality help at a cheap price. Our expert team is ready to assist you, making your academic journey smoother and more affordable. Don't miss out on this opportunity to enhance your skills and save on your studies. Take advantage of our offer now and secure top-notch help for your statistics assignments.
We Accept


- Understanding Regression Analysis
- Why Regression Analysis Matters
- Key Concepts in Regression Analysis
- 1. Linear Regression
- 2. Correlation vs. Regression
- 3. Assumptions of Linear Regression
- Steps in Performing Regression Analysis
- 1. Data Collection and Preparation
- 2. Choosing the Right Model
- 3. Running the Regression
- 4. Interpretation of Results
- 5. Visualization
- Practical Examples and Case Studies
- Example 1: Predicting ERMA 7310 Grades from ERMA 7300 Grades
- Example 2: Correlation Analysis
- Conclusion
Mastering regression analysis is crucial for excelling in your ERMA (Education Research Methods and Analysis) assignments. It's a powerful statistical technique that helps you understand relationships between variables, make predictions, and draw meaningful conclusions from data. In this comprehensive guide, we'll cover everything you need to know about regression analysis, from the basics to practical examples, to help you confidently tackle your regression analysis assignments and achieve academic success.
Let's dive into the essential concepts and steps of regression analysis, providing you with the knowledge and tools necessary to interpret data and make informed decisions. Whether you're new to regression analysis or looking to enhance your skills, this guide will equip you with the knowledge and confidence to handle regression assignments effectively.
Understanding Regression Analysis

Regression analysis is a fundamental statistical technique used extensively in research to examine relationships between variables. It allows researchers to understand how changes in one variable are associated with changes in another, providing insights into causal relationships and predictive modeling. In the context of ERMA (Education Research Methods and Analysis) assignments, mastering regression analysis is essential for interpreting data and making informed decisions based on statistical evidence.
In ERMA assignments, regression analysis enables researchers to predict outcomes based on observed data, quantify the strength of relationships between variables, and control for confounding factors. By understanding regression, researchers can uncover patterns and trends in data, which is crucial for drawing meaningful conclusions and making recommendations. Whether you're analyzing educational data or conducting research in other fields, regression analysis is a powerful tool that empowers researchers to uncover insights and contribute to the body of knowledge in their field of study.
Why Regression Analysis Matters
Regression analysis plays a pivotal role in empirical research and data-driven decision-making across various disciplines. Its significance lies in its ability to unravel intricate relationships between variables, thus facilitating a deeper understanding of phenomena under study. Let's delve into why regression analysis matters and explore its multifaceted benefits:
- Predict Outcomes: One of the primary utilities of regression analysis is its capacity to predict outcomes. By scrutinizing the relationship between independent and dependent variables, regression models enable researchers to forecast how changes in one variable may influence changes in another. This predictive prowess empowers stakeholders to anticipate future trends, behavior, or events, aiding in strategic planning and risk mitigation strategies.
- Understand Relationships: Regression analysis serves as a potent tool for elucidating the complex interplay between variables. By quantifying the strength and direction of associations, researchers gain valuable insights into the underlying relationships governing phenomena of interest. Whether exploring the impact of educational interventions on academic performance or investigating the determinants of economic growth, regression analysis unveils the intricacies of these relationships, fostering a more nuanced comprehension of the subject matter.
- Control for Confounding Variables:In real-world scenarios, numerous factors may simultaneously influence the outcome of interest. Confounding variables, if left unaddressed, can distort the observed relationships between variables, leading to erroneous conclusions. Regression analysis offers a mechanism to control for confounding variables by incorporating them into the analytical framework. Through techniques such as multiple regression or analysis of covariance (ANCOVA), researchers can isolate the effects of specific variables, thereby enhancing the accuracy and validity of their findings.
- Make Informed Decisions: In today's data-driven landscape, informed decision-making hinges on robust evidence derived from empirical analyses. Regression analysis furnishes stakeholders with empirical evidence to support their decision-making processes. Whether devising marketing strategies, formulating public policies, or optimizing business operations, decision-makers rely on regression findings to inform their choices. By grounding decisions in empirical evidence, organizations can mitigate risks, capitalize on opportunities, and steer towards favorable outcomes.
Key Concepts in Regression Analysis
In the realm of statistical analysis, regression analysis stands as a cornerstone for understanding the relationship between variables. Delving into the intricacies of regression analysis entails grasping several fundamental concepts that underpin its application and interpretation. Let's explore these key concepts in more detail:
1. Linear Regression
Linear regression is the most basic and commonly used form of regression analysis. It assumes a linear relationship between the dependent variable (Y) and one or more independent variables (X).
2. Correlation vs. Regression
- Correlation: Measures the strength and direction of a linear relationship between two variables.
- Regression:Predicts the value of the dependent variable based on the value of one or more independent variables.
3. Assumptions of Linear Regression
For regression analysis to be valid, several assumptions must be met:
- Linearity:The relationship between variables is linear.
- Independence:Observations are independent of each other.
- Normality:Residuals (errors) are normally distributed.
- Homoscedasticity: Variance of residuals is constant across all levels of the independent variables.
Steps in Performing Regression Analysis
1. Data Collection and Preparation
Data collection and preparation are crucial steps in regression analysis as they ensure that the data used for analysis is accurate and reliable.
- Data Retrieval:Obtaining relevant data for analysis is the first step. In the context of ERMA assignments, this may involve accessing datasets containing variables such as ERMA grades. Researchers may use data provided by educational institutions or collect their own data through surveys or experiments.
- Data Cleaning: Once the data is obtained, it is essential to clean it to remove any inconsistencies or errors that may affect the analysis. This includes identifying and handling outliers, which are data points that deviate significantly from the rest of the data, as well as addressing missing values. By cleaning the data, researchers ensure that it is ready for analysis and that the results obtained are accurate and reliable.
2. Choosing the Right Model
Choosing the right regression model is crucial for obtaining meaningful results from the analysis. Researchers must consider factors such as the nature of the data and the research question being addressed.
- Simple vs. Multiple Regression: Researchers must decide whether to use a simple regression model, which involves predicting a dependent variable based on a single independent variable, or a multiple regression model, which involves predicting a dependent variable based on multiple independent variables. This decision depends on the complexity of the relationship between the variables and the research question being addressed.
- Statistical Software: Once the type of regression model is chosen, researchers must select the appropriate statistical software for conducting the analysis. Popular options include SPSS, R, and Python, each of which offers various tools and functions for regression analysis. Researchers should choose the software that best suits their needs and familiarity with the program.
3. Running the Regression
Running the regression involves using the selected statistical software to perform the analysis and obtain the results.
- SPSS Tutorial:For researchers using SPSS, the regression analysis can be conducted by navigating to the "Analyze" menu, selecting "Regression," and then choosing "Linear Regression." Researchers can then specify the dependent and independent variables and run the analysis to obtain the results.
- Python/R Tutorial: Researchers using Python or R can perform regression analysis using libraries such as statsmodels or scikit-learn for Python, or the lm() function in R. These libraries offer various functions for conducting regression analysis, allowing researchers to specify the model and obtain the results using code.
4. Interpretation of Results
Once the regression analysis is complete, researchers must interpret the results to draw meaningful conclusions from the data.
- Coefficient Estimates:The coefficients obtained from the regression analysis represent the relationship between the independent and dependent variables. Researchers must interpret these coefficients to understand how changes in the independent variable(s) affect the dependent variable.
- P-values and Significance: P-values indicate the significance of the coefficients, with lower p-values suggesting stronger evidence against the null hypothesis. Researchers must determine if the results are statistically significant and whether they support the research hypothesis.
- Model Fit: Assessing the fit of the regression model is essential for evaluating its effectiveness in explaining the variation in the dependent variable. Researchers can use metrics such as R2R^2R2 or adjusted R2R^2R2 to assess how well the model fits the data and whether it provides a good representation of the relationship between the variables.
5. Visualization
Visualization is a powerful tool for understanding the relationship between variables and assessing the validity of the regression model.
- Scatterplot:Creating scatterplots allows researchers to visualize the relationship between the independent and dependent variables. This helps identify any patterns or trends in the data and assess the strength and direction of the relationship.
- Residual Plot: Residual plots are used to check for homoscedasticity and normality assumptions in the regression model. By plotting the residuals against the predicted values, researchers can identify any patterns or trends in the residuals and assess whether the assumptions of the regression model are met.
Practical Examples and Case Studies
Example 1: Predicting ERMA 7310 Grades from ERMA 7300 Grades
Suppose we have a dataset of 20 graduate students with their ERMA 7300 and ERMA 7310 grades. Let's perform regression analysis to predict ERMA 7310 grades based on ERMA 7300 grades.
SPSS Output:
- Regression Equation:
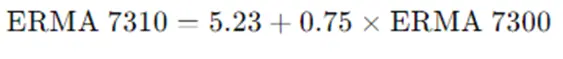
Interpretation:For every one-unit increase in ERMA 7300 grades, ERMA 7310 grades increase by 0.75 units.
Example 2: Correlation Analysis
SPSS Output:
- Correlation Coefficient: r = 0.85
- Interpretation: There is a strong positive correlation between ERMA 7300 and ERMA 7310 grades.
Conclusion
In conclusion, mastering regression analysis is crucial for successfully completing ERMA assignments and making informed decisions based on data. By thoroughly understanding the concepts, steps, and practical examples discussed in this comprehensive guide, you will be well-equipped to handle regression assignments with confidence and precision.
The ability to predict outcomes, understand relationships between variables, and control for confounding factors are invaluable skills that regression analysis provides. Whether using SPSS, R, Python, or other statistical tools, the process of collecting, cleaning, analyzing, and interpreting data becomes more straightforward and insightful with proficiency in regression techniques.