Avail Your Offer
Unlock success this fall with our exclusive offer! Get 20% off on all statistics assignments for the fall semester at www.statisticsassignmenthelp.com. Don't miss out on expert guidance at a discounted rate. Enhance your grades and confidence. Hurry, this limited-time offer won't last long!
We Accept
- Understanding the Assignment Structure
- Step 1: Summarizing Variables Using SPSS
- Step 2: Reporting in the Style of Supplement B
- Step 3: Hypothesis Testing and Z-Scores (Questions 4 and 5)
- Step 4: Interpreting and Writing Results
- Conclusion
Statistics assignments can vary in complexity, from basic descriptive analysis to more intricate inferential statistics. Among the most widely used tools for statistical data analysis is SPSS (Statistical Package for the Social Sciences), a powerful software specifically designed for managing and analyzing data sets. In academic assignments, particularly those involving statistical analysis, SPSS serves as an essential tool to perform tasks such as summarizing variables, generating descriptive statistics, and interpreting the results of hypothesis tests. The attached assignment is a typical example of a task that requires students to summarize and interpret data related to different variables such as Birth Order, Height, and Internal Aggression. To effectively solve your SPSS assignment, students must first grasp the core statistical concepts, such as central tendency, variability, and inferential testing. This blog will provide a thorough theoretical approach to solving assignments like this, covering the steps required to summarize variables, interpret statistical outputs, and apply advanced concepts like z-scores and hypothesis testing. By following this approach, students can enhance their understanding of both the theoretical and practical aspects of statistics, which is crucial for successfully completing similar assignments.

Understanding the Assignment Structure
The assignment consists of multiple questions, each dealing with a different variable (such as Birth Order, Height, and Internal Aggression). The first three questions involve summarizing variables using SPSS, while the last two require statistical analysis but without the use of SPSS.
This structure is common in statistics assignments because it requires students to engage with both the data analysis software and statistical theory. Here's a step-by-step guide to approaching each type of question you may encounter in such an assignment.
Step 1: Summarizing Variables Using SPSS
In the first three questions of the attached assignment, students are asked to summarize specific variables (Birth Order, Height, and Internal Aggression) using SPSS. Summarizing variables means understanding the central tendency, dispersion, and shape of the distribution of data. This is typically done through the following steps:
- Load Data: Open the dataset in SPSS. Ensure that the data is properly cleaned and organized for analysis. Each variable should be appropriately labeled with its correct scale (nominal, ordinal, or interval).
- Descriptive Statistics: Use SPSS’s Descriptive Statistics function to generate summary statistics for each variable. For example, when summarizing a continuous variable like Height, SPSS will provide the mean, median, mode, standard deviation, variance, and range.
- Interpretation: Once you have the summary statistics, write a paragraph interpreting the key features of the data. This interpretation should explain:
- The central tendency (mean, median, mode) and which measure best represents the typical value of the variable.
- The dispersion (standard deviation, range) and how spread out the data is around the central tendency.
- Any skewness (whether the data is asymmetrical) or kurtosis (whether the data is heavily peaked or flat) observed in the distribution.
For categorical variables like Birth Order, SPSS can produce frequency distributions, showing the count and percentage of each category. For ordinal or interval variables like Internal Aggression, SPSS will calculate the mean, standard deviation, skewness, and kurtosis, which offer insights into the distribution’s shape.
For example, in the Birth Order variable, if the frequency distribution shows a large proportion of data points in the first birth order, you might mention that most of the participants are first-born, affecting the interpretation of related factors.
Step 2: Reporting in the Style of Supplement B
The style of reporting in the assignment is specified in Supplement B, which gives guidelines for reporting data analysis. The key features that need to be included in your report are:
- Context: Briefly explain what the variable represents and the significance of summarizing it.
- Summary Statistics: Present the summary statistics in a clear and concise manner. For example, "The mean height of the participants was 170 cm with a standard deviation of 5 cm."
- Interpretation: Highlight the most important patterns in the data. Is there any significant skewness or kurtosis? Does the data exhibit any unusual features that could suggest anomalies or interesting trends?
This format helps students focus on the key features of the data, ensuring they provide a comprehensive yet focused explanation of the results.
Step 3: Hypothesis Testing and Z-Scores (Questions 4 and 5)
While the first three questions require summarizing data, questions 4 and 5 shift focus to hypothesis testing and z-scores. Let’s break these down further:
Relative Performance (Z-Scores)
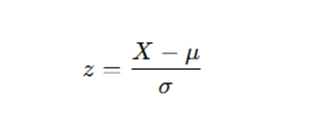
This question involves comparing Susan’s performance in three competitions, where each competition has its own mean and standard deviation. The best way to assess her relative performance is to calculate her z-scores in each competition. A z-score tells you how far a data point is from the mean, measured in standard deviations.
The formula for the z-score is:

Where:
- X is Susan’s score.
- μ is the mean score for the competition.
- σ is the standard deviation for the competition.
By calculating the z-score for each competition, we can determine which competition Susan performed best in relative to the other participants. A higher z-score indicates a better performance relative to the mean of the competition.
Testing a Claim (One-Sample Z-Test)
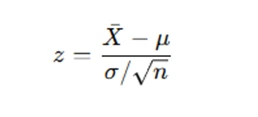
This question involves testing the consumer organization’s belief that the operating time of the alkaline batteries is lower than claimed. Since the population standard deviation is known, we can use a one-sample z-test to determine if the sample mean significantly differs from the population mean.
The hypothesis test is structured as follows:
- Null Hypothesis (H₀): The average operating time of the batteries is 20.00 hours.
- Alternative Hypothesis (H₁): The average operating time of the batteries is less than 20.00 hours.
The formula for the z-test is:

Where:
- Xˉ is the sample mean.
- μ is the population mean.
- σ is the population standard deviation.
- n is the sample size.
Once the z-value is calculated, compare it to the critical z-value from the standard normal distribution table at the desired significance level (typically 0.05). If the calculated z-value is less than the critical value, you can reject the null hypothesis and conclude that the sample mean is significantly lower than 20.00 hours.
Step 4: Interpreting and Writing Results
After performing all necessary calculations and analysis, the final step is to write the interpretation. Here’s how to interpret the results for questions involving hypothesis testing:
- State the hypothesis: Clearly define the null and alternative hypotheses.
- Calculate the test statistic: Use the appropriate formula (such as the z-test for a known population standard deviation).
- Make a decision: Compare the calculated statistic to the critical value or use the p-value approach to determine whether to reject the null hypothesis.
- Draw a conclusion: Based on the decision, provide a conclusion. For example, "The sample mean is significantly different from the population mean, supporting the consumer organization's belief."
For the z-scores, you would interpret Susan’s performance in each competition by comparing the z-scores. The higher the z-score, the better Susan’s performance relative to others.
Conclusion
Statistics assignments often require a blend of technical proficiency and theoretical understanding. Technical knowledge, such as how to use tools like SPSS and apply formulas, is crucial for performing accurate data analysis. Equally important is the ability to interpret the results meaningfully, drawing insights from the data that align with the context of the problem. By following a structured approach, students can effectively summarize data, apply appropriate hypothesis tests, and interpret their findings to demonstrate a deep understanding of statistical concepts. For example, when using SPSS to summarize variables, you must interpret central tendency, dispersion, and the shape of the data distribution correctly. Similarly, when calculating z-scores for hypothesis testing, a clear understanding of how to interpret the results is essential for making sound conclusions. To successfully complete your statistics assignment, it’s important to break down each task into manageable steps, ensuring you follow the correct procedures and interpret the data thoughtfully. This approach ensures that your analysis is both accurate and insightful, enhancing the overall quality of your assignment.


