How to Tackle Data Visualization and Machine Learning Assignments on Health Analytics

Claim Your Offer
Unlock an exclusive deal at www.statisticsassignmenthelp.com with our Spring Semester Offer! Get 10% off on all statistics assignments and enjoy expert assistance at an affordable price. Our skilled team is here to provide top-quality solutions, ensuring you excel in your statistics assignments without breaking the bank. Use Offer Code: SPRINGSAH10 at checkout and grab this limited-time discount. Don’t miss the chance to save while securing the best help for your statistics assignments. Order now and make this semester a success!
We Accept


- Understanding the Assignment Scope
- Initial Data Exploration and Statistical Analysis
- Data Transformation Techniques
- Deriving Further Insights from Data
- Machine Learning Model Implementation
- Interpretation of Model Results
- Drawing Conclusions and Reflection
- Conclusion
Data analytics and visualization play a crucial role in various industries, especially in health analytics, where insights derived from patient data can lead to better medical decisions and policies. In academic settings, students often encounter assignments requiring them to analyze datasets containing health-related metrics such as BMI, blood pressure, smoking habits, and serum creatinine levels. These assignments challenge students to demonstrate their ability to clean, visualize, and interpret data, while also applying statistical and machine learning techniques for predictive modeling. The complexity of these assignments stems from the need to handle missing values, detect patterns, and draw actionable insights from raw data.
Understanding how to approach such assignments systematically is essential for students to develop strong analytical skills. This blog provides a structured approach to solving these assignments, covering essential steps such as data exploration, transformation, visualization, and modeling. By following these strategies, students can enhance their ability to work with health data and extract meaningful conclusions that could be applicable in real-world scenarios. Whether you are working on a health-related dataset or need to solve your data visualization project, these techniques will help you tackle the challenges effectively.

Understanding the Assignment Scope
Data visualization and machine learning assignments in health analytics often require students to analyze datasets containing patient information, such as BMI, blood pressure, smoking habits, and serum creatinine levels. These assignments test a student's ability to clean, visualize, and model data while drawing meaningful insights.
To effectively approach such assignments, it is essential to:
- Understand the dataset and its variables
- Perform preliminary statistical analysis
- Apply data transformation techniques
- Generate further insights using analytical techniques
- Implement machine learning models for prediction and classification
- Draw conclusions based on findings
Initial Data Exploration and Statistical Analysis
Before proceeding with complex modeling, students must conduct an exploratory data analysis (EDA) to understand the dataset's structure. This involves:
- Checking for missing values and outliers
- Understanding the distribution of key variables (e.g., BMI, blood pressure)
- Calculating summary statistics (mean, median, standard deviation)
- Exploring relationships between variables
For example, calculating the average BMI for males and females in the dataset provides an initial understanding of health trends:
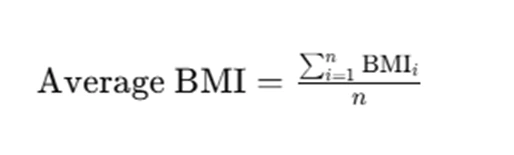
where n is the number of individuals in the dataset.
Students should also conduct correlation analysis to identify dependencies between different variables. For instance, analyzing the correlation between age and systolic blood pressure can provide insights into hypertension risks in different age groups.
Data Transformation Techniques
Real-world datasets often contain inconsistencies, requiring various data transformation techniques:
- Normalization and Standardization: Ensuring values fall within a common scale for effective machine learning model training.
- Encoding Categorical Variables: Converting categorical data (e.g., smoker/non-smoker) into numerical format for analysis.
- Handling Missing Data: Using imputation techniques (mean, median, mode) to fill missing values.
For example, if serum creatinine levels vary significantly by gender, normalization might be necessary to compare values accurately. Additionally, outliers in medical datasets should be carefully examined to avoid misleading results.
Deriving Further Insights from Data
Once the dataset is cleaned and transformed, deeper insights can be generated through:
- Correlation analysis to determine relationships between variables (e.g., age and systolic blood pressure):
- Grouping and segmentation (e.g., analyzing smoking habits across different age groups).
- Trend identification to observe patterns in health indicators over time or across demographics.
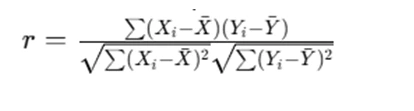
where X and Y represent the two variables being compared.
For instance, a dataset may reveal that younger individuals are more likely to smoke, while older individuals may have higher blood pressure levels. Identifying such patterns can provide valuable insights for public health interventions.
Machine Learning Model Implementation
In assignments requiring predictive analysis, students are often expected to apply machine learning models such as:
- Linear Regression (for continuous variables like blood pressure predictions)
- Logistic Regression (for binary classification, e.g., smoker vs. non-smoker)
- Decision Trees and Random Forests (for more complex classifications)
A typical workflow includes:
- Defining the target variable (e.g., predicting high blood pressure)
- Selecting independent variables (age, BMI, smoking status)
- Splitting data into training and testing sets
- Evaluating model accuracy using metrics like R-squared or confusion matrices
For example, a linear regression model for predicting systolic blood pressure (SBP) based on age might be represented as:
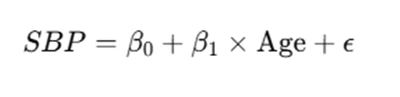
where β0 and β1 are coefficients determined through training, and ε is the error term.
Interpretation of Model Results
Once models are built, their performance must be evaluated using appropriate metrics. These include:
- Mean Absolute Error (MAE)
- Root Mean Squared Error (RMSE)
- Accuracy and Precision for classification models
Interpreting the model results helps students assess whether their predictions align with real-world expectations. For example, if a model predicting systolic blood pressure has a low RMSE, it indicates strong predictive accuracy.
Drawing Conclusions and Reflection
After conducting analysis and modeling, the final step is to interpret findings. Students should:
- Compare predicted outcomes with real data.
- Discuss limitations (e.g., biases in data collection).
- Provide actionable insights (e.g., recommending lifestyle changes for high-risk groups).
Additionally, reflecting on the challenges encountered during the analysis—such as data cleaning difficulties or model performance issues—can provide valuable learning experiences for future assignments.
Conclusion
Solving health analytics assignments requires a structured approach combining statistical analysis, data transformation, visualization, and machine learning modeling. By carefully following these steps, students can generate meaningful insights and improve their problem-solving skills in real-world data analysis. Understanding the dataset, applying proper transformations, and implementing the right analytical techniques are crucial steps in extracting valuable conclusions from health-related data.
Additionally, mastering these techniques ensures that students develop a keen eye for data interpretation, which is essential when dealing with complex datasets. By refining their skills in data preprocessing, visualization, and predictive modeling, students can gain deeper insights into how health-related variables interact and influence each other. A structured approach not only enhances academic performance but also prepares students for practical applications in the healthcare industry, where data-driven decision-making is essential.
With a methodical approach, students can enhance their proficiency in handling complex datasets and making data-driven decisions in the field of health analytics. Whether tackling predictive modeling, correlation analysis, or trend identification, these techniques will allow students to effectively complete their statistics assignment and produce reliable, data-backed conclusions that can be applied in real-world scenarios. By integrating statistical methodologies and leveraging machine learning models, students can extract patterns, derive insights, and contribute to meaningful health research.