How to Break Down Biostatistics Assignments Involving Regression Analysis

Claim Your Offer
Unlock an exclusive deal at www.statisticsassignmenthelp.com with our Spring Semester Offer! Get 10% off on all statistics assignments and enjoy expert assistance at an affordable price. Our skilled team is here to provide top-quality solutions, ensuring you excel in your statistics assignments without breaking the bank. Use Offer Code: SPRINGSAH10 at checkout and grab this limited-time discount. Don’t miss the chance to save while securing the best help for your statistics assignments. Order now and make this semester a success!
We Accept


- Understanding Biostatistics Assignments with Regression Analysis
- Key Components of Regression-Based Biostatistics Assignments
- Step 1: Defining the Research Scenario
- Step 2: Formulating Hypotheses
- Step 3: Developing the Regression Model
- Step 4: Assessing Statistical Significance
- Step 5: Interpreting Regression Coefficients
- Step 6: Evaluating Model Fit
- Step 7: Making Predictions
- Applying Regression to Other Biostatistics Assignments
- Conclusion
Biostatistics is a crucial field that applies statistical methods to biological and health-related research. Many assignments in biostatistics require analyzing complex datasets using statistical techniques, particularly regression analysis. These assignments help students understand relationships between variables and draw meaningful conclusions from data. One common type of biostatistics assignment involves applying bivariate and multiple linear regression techniques to study various factors affecting an outcome variable. Whether examining corporate executive stress, caregiver burden, or students’ physical activity levels, a structured approach to regression analysis is essential. This blog provides a comprehensive, theoretical framework to guide students through solving such assignments, helping them complete their biostatistics assignment with accuracy and confidence. The focus will be on understanding the steps involved, from hypothesis formulation to model interpretation, ensuring clarity and precision in statistical analyses. By mastering these concepts, students can enhance their analytical skills and apply them effectively in both academic and real-world research settings.
Understanding Biostatistics Assignments with Regression Analysis

Biostatistics assignments often require students to analyze datasets using statistical techniques such as bivariate regression and multiple linear regression. These methods help in understanding relationships between dependent and independent variables. Solving such assignments requires a structured approach, incorporating hypothesis formulation, model development, statistical significance testing, and interpretation of results. This blog provides a theoretical framework for solving biostatistics assignments that involve regression analysis, closely aligned with real-world scenarios like those in academic coursework.
Key Components of Regression-Based Biostatistics Assignments
A typical biostatistics assignment involving regression analysis requires students to:
- Define the research scenario – Identify the problem statement and dependent and independent variables.
- Formulate hypotheses – Establish null and alternative hypotheses for statistical testing.
- Develop the regression model – Construct the mathematical equation relating predictor variables to the outcome.
- Assess statistical significance – Evaluate the model's reliability using p-values and confidence intervals.
- Interpret regression coefficients – Determine the impact of predictor variables on the dependent variable.
- Evaluate model fit – Assess how well the model explains the variation in the dependent variable.
- Make predictions – Use the regression equation to estimate outcomes for new data points.
By following these steps systematically, students can effectively solve complex biostatistics assignments that require regression analysis.
Step 1: Defining the Research Scenario
A biostatistics assignment may present a dataset containing variables such as stress levels among executives, caregivers' burden, or students’ physical activity. The first step in solving such an assignment is to clearly define the dependent variable (outcome) and independent variables (predictors).
For example, in an assignment analyzing stress among executives, the dependent variable might be the stress level, while the independent variables could include:
- Firm size
- Years of experience
- Age
- Annual salary
The objective of the analysis is to determine how these factors influence stress levels.
Step 2: Formulating Hypotheses
The hypotheses establish the foundation for statistical analysis. The null hypothesis (H₀) assumes that no relationship exists between the dependent and independent variables, while the alternative hypothesis (H₁) suggests that at least one predictor significantly affects the outcome.
For a multiple regression analysis on executive stress, the hypotheses could be:
- H₀: Firm size, experience, age, and salary have no significant effect on stress levels.
- H₁: At least one of the independent variables significantly influences stress levels.
Step 3: Developing the Regression Model
The multiple linear regression model takes the form:
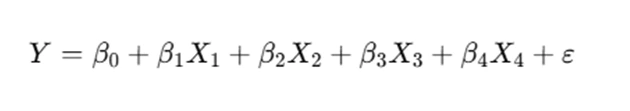
Where:
- Y= Dependent variable (stress level)
- X1, X2,X3, X4= Independent variables (firm size, experience, age, salary)
- β0= Intercept
- β1, β2, β3,β4 = Regression coefficients
- ε = Error term
This equation quantifies how each predictor variable contributes to changes in the dependent variable.
Step 4: Assessing Statistical Significance
The statistical significance of the regression model is evaluated using the p-value. If the p-value for a predictor is less than the chosen significance level (e.g., X=o.05 ), the predictor significantly affects the outcome variable.
Additionally, the overall model significance is assessed using the F-statistic from the ANOVA table. A significant F-test indicates that at least one predictor variable is meaningful in explaining the variation in the dependent variable.
Step 5: Interpreting Regression Coefficients
Each regression coefficient β() represents the expected change in the dependent variable for a one-unit change in the corresponding predictor, assuming other variables remain constant.
For instance, if the coefficient for firm size is 0.5, it implies that a one-unit increase in firm size leads to a 0.5-unit increase in stress level, assuming all other factors are held constant.
Step 6: Evaluating Model Fit
The model's explanatory power is determined using R2, which represents the proportion of variance in the dependent variable explained by the independent variables.
- High R2 (close to 1.0) indicates a strong relationship between predictors and the outcome.
- Low R2 (close to 0.0) suggests that predictors do not explain much of the variation in the outcome.
Additionally, adjusted R2 accounts for the number of predictors, preventing overestimation of model performance.
Step 7: Making Predictions
Once the regression model is established, it can be used to predict outcomes for new data. Given specific values for independent variables, the regression equation can estimate the corresponding dependent variable.
For example, suppose an assignment requires predicting stress levels for an executive aged 66, with 22 years of experience, earning $58,000 annually, and working in a firm with 1,100 employees. The regression equation allows for direct computation of stress level by substituting these values.
Applying Regression to Other Biostatistics Assignments
Biostatistics assignments often involve different datasets, but the fundamental approach remains the same. Other examples include:
- Examining how social cognitive factors influence students’ exercise habits
- Assessing caregiver burden based on age, income, and support systems
Regardless of the dataset, applying the structured regression analysis approach ensures accuracy and clarity in statistical assignments.
Conclusion
Solving biostatistics assignments involving regression analysis requires a systematic approach, starting with defining the research problem, formulating hypotheses, constructing a regression model, and evaluating statistical significance. By mastering these steps, you can solve your statistics assignment effectively, analyze real-world datasets, and draw meaningful conclusions. A strong grasp of regression techniques not only enhances academic performance but also prepares students for practical applications in research and data analysis.