How to Approach Statistical Data Analysis Assignment on Airline Operations

Claim Your Offer
Unlock an exclusive deal at www.statisticsassignmenthelp.com with our Spring Semester Offer! Get 10% off on all statistics assignments and enjoy expert assistance at an affordable price. Our skilled team is here to provide top-quality solutions, ensuring you excel in your statistics assignments without breaking the bank. Use Offer Code: SPRINGSAH10 at checkout and grab this limited-time discount. Don’t miss the chance to save while securing the best help for your statistics assignments. Order now and make this semester a success!
We Accept


- Understanding the Assignment Requirements
- Data Preparation and Cleaning
- Statistical Analysis Techniques
- 1. Calculating Key Descriptive Statistics
- 2. Comparative Analysis Between Airlines
- 3. Identifying Peak Delay Days
- Visualization Techniques
- 1. Creating a Line Chart for Delayed Flights
- 2. Generating a Scatterplot
- Conclusion
Statistical data analysis plays a crucial role in understanding airline operations. Analyzing operational statistics such as delays, on-time performance, and other metrics helps airlines improve efficiency and optimize scheduling. Statistical insights guide airline management in making data-driven decisions that can enhance customer satisfaction and reduce operational costs.
Aviation statistics involve extensive data sets containing various performance indicators. When tasked with analyzing airline operations data, students need to apply statistical methods to extract meaningful insights. This blog outlines a structured approach to solving statistical data analysis assignments related to airline operations, using an example of a study on flight departures from a major airport.
This comprehensive guide will help students understand the key steps involved in analyzing airline operational statistics, from preparing data and applying statistical methods to interpreting results and presenting findings effectively. Whether you need to complete your data analysis assignment or improve your understanding of airline performance, this guide provides valuable insights. The focus will be on solving assignments that require statistical techniques for performance evaluation, including delays, flight frequency, and comparisons between airlines.

Understanding the Assignment Requirements
Before beginning any statistical analysis, carefully read the assignment instructions. The requirements usually outline the dataset, statistical measures to be calculated, and expected deliverables. Here are some key aspects to focus on:
- Dataset Provided: Airline operations assignments typically include datasets containing flight information, such as departure times, scheduled departure times, airline names, and delay statistics. The dataset may contain multiple records for different dates, airports, or carriers.
- Statistical Measures Required: Assignments often require computing measures such as minimum, maximum, and mean delays, comparisons between airlines, and identifying trends across different time periods.
- Visualization Requirements: Charts and plots, such as scatterplots and line charts, are commonly used to illustrate statistical findings.
- Interpretation of Results: Assignments typically require a written report that explains the calculations, insights derived, and comparisons made.
Understanding these components ensures that students approach the assignment in a structured and effective manner.
Data Preparation and Cleaning
Proper data preparation is essential for ensuring accurate analysis. The quality of the dataset directly affects the reliability of the results. Here’s a systematic approach to preparing airline operations data:
- Open and Explore the Dataset
- Identify Relevant Variables
- Flight number: Unique identifier for flights.
- Scheduled Departure Time (CRS_DEP_TIME): Planned departure time.
- Actual Departure Time (DEP_TIME): The recorded departure time.
- Delay Time: The difference between actual and scheduled departure time.
- Day of the Week: Helps identify patterns in delays.
- Airline Name: Differentiates between different carriers.
- Handle Missing or Erroneous Data
- Remove incomplete records if the missing values are significant.
- Impute missing values using mean or median values if the missing data is minimal.
- Correct errors such as negative departure times or unrealistic delay values.
- Create Derived Variables
Begin by loading the dataset into statistical software such as Excel, R, or Python. Review the structure of the dataset, column names, data types, and missing values. Familiarize yourself with the variables and their significance.
Key variables in airline operations analysis typically include:
Focusing on these variables allows for precise analysis.
Real-world datasets often contain missing or inconsistent data. Use the following techniques to clean data:
To calculate flight delays, subtract the scheduled departure time from the actual departure time:

This derived variable is essential for further statistical analysis.
Statistical Analysis Techniques
After preparing the dataset, the next step is applying statistical techniques to extract insights.
1. Calculating Key Descriptive Statistics
Descriptive statistics summarize the main features of the dataset. The key measures to compute include:
- Minimum, Maximum, and Mean Delays: These statistics provide an overview of airline performance. The mean delay is given by:
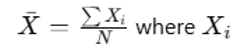 represents each delay value, and N is the total number of flights.
 - Daily Mean Delay for Delayed Flights: This metric focuses on flights that experienced delays, providing a clearer picture of airline punctuality.
- Total Delayed Flights Per Day: Helps identify peak disruption days.
2. Comparative Analysis Between Airlines
Comparing airlines involves:
- Evaluating mean delays per airline per day.
- Identifying the highest and lowest delay occurrences.
- Analyzing the number of delayed flights for each airline.
This analysis helps determine which airline manages delays more effectively.
3. Identifying Peak Delay Days
To determine the worst-performing days:
- Aggregate total delay minutes per day.
- Identify the highest and lowest values.
- Find the day with the most delayed flights.
Visualization Techniques
Visualizations provide a clearer understanding of statistical trends.
1. Creating a Line Chart for Delayed Flights
A line chart with markers is effective for illustrating trends:
- X-axis: Days of the week.
- Y-axis: Number of delayed flights.
- Separate lines for each airline to compare their performance.
2. Generating a Scatterplot
A scatterplot of departure delays helps visualize outliers and trends in the dataset.
Interpretation and Reporting
Once the analysis is complete, findings should be interpreted and presented in a structured report.
- Summarize Key Findings: Highlight significant results such as mean delays, best and worst-performing days, and airline comparisons.
- Discuss Anomalies: Explain any unexpected trends or deviations.
- Provide Recommendations: Suggest improvements for airline operations based on findings.
Conclusion
Solving statistical data analysis assignments on airline operations requires a systematic approach that involves multiple critical steps, helping you solve your statistics assignment effectively, making it essential to adopt effective strategies to solve your statistics assignment. The process begins with carefully cleaning and preparing the dataset, ensuring accuracy by handling missing values and errors. Next, performing statistical calculations such as determining mean, maximum, and minimum delays provides key insights into airline punctuality. Visualization techniques, including scatterplots and line charts, further help in identifying trends, patterns, and anomalies that might otherwise go unnoticed. Once the statistical analysis is complete, interpreting findings becomes crucial, as it allows students to draw meaningful conclusions regarding airline performance and operational efficiency. By systematically working through these stages, students develop a deeper understanding of aviation data, enabling them to make data-driven observations. This structured methodology not only enhances analytical skills but also provides valuable insights that can support airline management in making informed operational decisions, ultimately leading to improved efficiency and customer satisfaction.