How to Analyze Statistical Assignments Based on Waste Management Data
Claim Your Offer
Unlock an exclusive deal at www.statisticsassignmenthelp.com with our Spring Semester Offer! Get 10% off on all statistics assignments and enjoy expert assistance at an affordable price. Our skilled team is here to provide top-quality solutions, ensuring you excel in your statistics assignments without breaking the bank. Use Offer Code: SPRINGSAH10 at checkout and grab this limited-time discount. Don’t miss the chance to save while securing the best help for your statistics assignments. Order now and make this semester a success!
We Accept


- Understanding the Objective
- Steps to Solve Waste Management Data Analysis Assignments
- 1. Data Loading and Preparation
- 2. Calculating Growth Rates
- 3. Performing Descriptive Statistics
- 4. Conducting Entity-Level Analysis
- 5. Visualizing Data
- 6. Performing Correlation Analysis
- 7. Workforce Impact on Waste Management
- 8. Seasonal and Temporal Trends
- Conclusion
Waste management has become a crucial area of study due to its environmental, economic, and public health implications. Statistical analysis plays a vital role in understanding waste generation patterns, assessing waste management efficiency, and formulating data-driven strategies for sustainable waste disposal. In academic settings, students are often tasked with assignments that involve evaluating waste quantities, growth rates, and correlations among different waste types. These assignments require the application of statistical techniques, including descriptive analytics, growth rate calculations, correlation analysis, and data visualization. A thorough understanding of these methods is essential for deriving meaningful insights and making informed decisions about waste management practices. This blog provides a detailed approach to solving such assignments, helping students complete their statistics assignment efficiently by focusing on key statistical methods, entity-level analysis, and workforce impact. By following these steps, students can develop a structured methodology for analyzing waste management data and presenting their findings effectively.
Understanding the Objective

Assignments focused on waste management data analysis typically involve evaluating the quantities and growth rates of various waste types over time and across different entities. The objective is to derive meaningful insights using descriptive and inferential statistical techniques. These assignments often require analyzing datasets containing multiple waste categories, such as organic, cardboard, plastic, minerals, and glass waste, and interpreting their statistical properties.
Steps to Solve Waste Management Data Analysis Assignments
1. Data Loading and Preparation
The first step in any data analysis assignment is to load and clean the dataset. The data is often extracted from an Excel file or another structured format containing waste quantities categorized by type, entity, and time period. The following preprocessing steps ensure a well-structured dataset:
- Sorting the data chronologically by entity, year, and period.
- Handling missing values by either imputing them using statistical techniques (e.g., mean imputation) or removing incomplete entries if necessary.
- Converting categorical variables (such as entity names) into appropriate formats for statistical analysis.
- Identifying and addressing outliers that may skew analysis results.
- Standardizing units of measurement to maintain consistency across data points.
2. Calculating Growth Rates
A crucial aspect of waste management analysis is determining how different waste types grow over time. The quarter-over-quarter (QoQ) growth rate is a commonly used metric, calculated as:
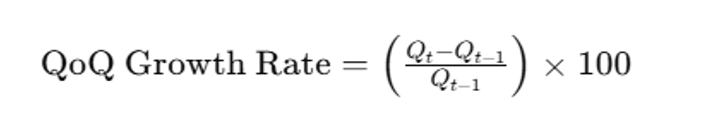
where:
- Qt represents the waste quantity in the current quarter,
- Qt-1 represents the waste quantity in the previous quarter.
This helps in identifying seasonal trends and fluctuations in waste production. If a particular waste type exhibits consistent growth, it may indicate increasing consumption patterns, inefficiencies in waste management, or seasonal variations affecting waste generation.
3. Performing Descriptive Statistics
Descriptive statistics provide a comprehensive summary of the data distribution. The following metrics should be calculated for each waste type:
- Mean: The average waste quantity per category.
- Median: The central value, which is useful when data is skewed.
- Standard Deviation: Measures data dispersion around the mean.
- Variance: Indicates the spread of waste quantities within the dataset.
- Skewness: Measures asymmetry in data distribution.
- Kurtosis: Helps determine the presence of outliers.
- Range: The difference between the highest and lowest waste quantities, highlighting variability.
- Confidence Intervals: Estimating the range within which the true mean waste quantity lies with a given probability.
Interpreting these statistics allows for understanding which waste types exhibit high variability and which follow a more stable distribution.
4. Conducting Entity-Level Analysis
To assess how waste generation varies across different municipalities or entities, we compute:
- The total and average quantity of each waste type per entity.
- The highest and lowest waste-generating entities.
- The distribution of waste quantities across entities using box plots to detect outliers.
- Identifying municipalities with excessive waste production and potential factors contributing to high waste levels.
For example, if one municipality consistently generates the most organic waste, further investigation into its waste management policies may be required.
5. Visualizing Data
Statistical assignments often require visualization to support findings. Effective charts include:
- Line plots to illustrate waste quantity trends over time.
- Box plots to display the spread of waste data and detect outliers.
- Heatmaps to analyze correlations between different waste types.
- Scatter plots to explore relationships between workforce metrics (e.g., number of cleaners) and total waste managed.
- Pie charts to show the proportional contribution of different waste types.
6. Performing Correlation Analysis
Understanding relationships between waste types is essential in deriving meaningful conclusions. A correlation matrix quantifies the degree of association between different waste categories.
For instance:
- A strong positive correlation between cardboard and plastic waste may indicate similar sources (e.g., packaging materials).
- A weaker correlation between organic waste and mineral waste suggests these types are generated by different processes.
The correlation coefficient r ranges from -1 to 1, where:
- r ≈ 1: Strong positive correlation (both waste types increase together).
- r ≈ -1: Strong negative correlation (one increases, the other decreases).
- r ≈ 0: No significant relationship.
7. Workforce Impact on Waste Management
In many cases, analyzing the relationship between workforce metrics (e.g., the number of cleaners) and total waste collection provides valuable insights. A strong correlation (e.g., r=0.9) suggests that having more cleaners leads to higher waste collection efficiency.
This information helps municipalities optimize resource allocation to improve waste management effectiveness. Workforce efficiency metrics may include:
- The average waste collected per cleaner.
- The impact of additional workers on waste collection performance.
- Variability in waste collection efficiency across different entities.
8. Seasonal and Temporal Trends
Identifying seasonal trends in waste production can inform better waste management strategies. By analyzing waste quantities across different quarters, we can determine whether:
- Certain waste types peak during specific seasons.
- Municipalities experience fluctuating waste levels due to external factors (e.g., tourism, holidays).
- Recycling programs effectively reduce specific waste types over time.
Conclusion
Solving waste management data analysis assignments requires a systematic approach, from data preparation to advanced statistical analysis. By leveraging growth rate calculations, descriptive statistics, correlation analysis, and data visualization, students can derive meaningful insights from real-world waste data. Understanding entity-level differences and workforce impact further enhances analytical depth.
Through these steps, students can efficiently tackle assignments focusing on waste management data while gaining practical experience in statistical interpretation and decision-making. The ability to critically analyze waste data empowers students to contribute to sustainability efforts and develop data-driven solutions for efficient waste management. Implementing these statistical techniques ensures accurate, insightful analysis, providing a solid foundation for making informed decisions in environmental studies and waste management research.